| |
DIABLO statistics for newsfeed.yoursite.com on Tue 30 Jul 2024 |
Generated on 20240730 2358 by feeder-stats v4.006. Copyright © 2002 The Diablo Project.
Diablo running processes:  81    Dnewslink running processes:  0


11:59PM  up 163 days,  7:18, 0 users, load averages: 0.97, 0.68, 0.69

Filesystem     Size    Used   Avail Capacity  Mounted on
/dev/da0s1g     94G    1.2G     85G     1%    /news
/dev/da1       7.3T    6.6T     64G    99%    /news2/spool/news/00
/dev/da2       7.3T    6.6T     63G    99%    /news2/spool/news/01
/dev/da3       3.7T    3.2T    114G    97%    /news2/spool/news/02
/dev/da4       5.5T      5T     86G    98%    /news2/spool/news/03
/dev/da8       7.3T    6.6T     65G    99%    /news2/spool/news/04
/dev/da9       7.3T    6.6T     62G    99%    /news2/spool/news/05
/dev/da10      7.3T    6.6T    121G    98%    /news2/spool/news/06
/dev/da11      5.5T    4.9T    118G    98%    /news2/spool/news/07
/dev/da12      5.5T      5T     86G    98%    /news2/spool/news/08
/dev/da13      7.3T    6.6T    118G    98%    /news2/spool/news/09
/dev/da14      7.3T    6.6T    118G    98%    /news2/spool/news/10
/dev/da15      7.3T    6.6T    118G    98%    /news2/spool/news/11
/dev/da16      7.3T    6.6T     63G    99%    /news2/spool/news/12
/dev/da17      7.3T    6.6T    120G    98%    /news2/spool/news/13
/dev/da18      7.3T    6.6T     64G    99%    /news2/spool/news/14
/dev/da19      7.3T    6.6T    119G    98%    /news2/spool/news/15
/dev/da20      7.3T    6.6T    119G    98%    /news2/spool/news/16
/dev/da21      7.3T    6.6T    117G    98%    /news2/spool/news/17
/dev/da22      7.3T    6.6T    120G    98%    /news2/spool/news/18
/dev/da23      7.3T    6.6T    120G    98%    /news2/spool/news/19
/dev/da24      7.3T    6.6T     63G    99%    /news2/spool/news/20
/dev/da25      7.3T    6.6T    121G    98%    /news2/spool/news/21
/dev/da26      7.3T    6.6T     62G    99%    /news2/spool/news/22
/dev/da5       221G     35G    168G    18%    /news1
/dev/md0        40G     13G     22G    39%    /news3
| Incoming Feed (+ Top1000 #) | Accepted | %Acc | %Tot | Art/sec | Volume | %Vol | KB/art | Check | Ihave | Spam | TooOld | Rejs | Errs | ||
|---|---|---|---|---|---|---|---|---|---|---|---|---|---|---|---|
| 1 | feeder.ecngs.de | 5780487 | 95.22 | 95.61 | 66.90 | 3.50TB | 99.94 | 650.32 | 6070303 | 0 | 0 | 0 | 192 | 0 | |
| 2 | feeder2.ecngs.de | 265681 | 91.53 | 4.39 | 3.08 | 2.14GB | 0.06 | 8.44 | 290133 | 0 | 0 | 0 | 133 | 0 | |
| Total | 6046168 | 0.00 | 100.00 | 69.98 | 3.50TB | 100.00 | 622.12 | 6360436 | 0 | 0 | 0 | 325 | 0 | ||
 |
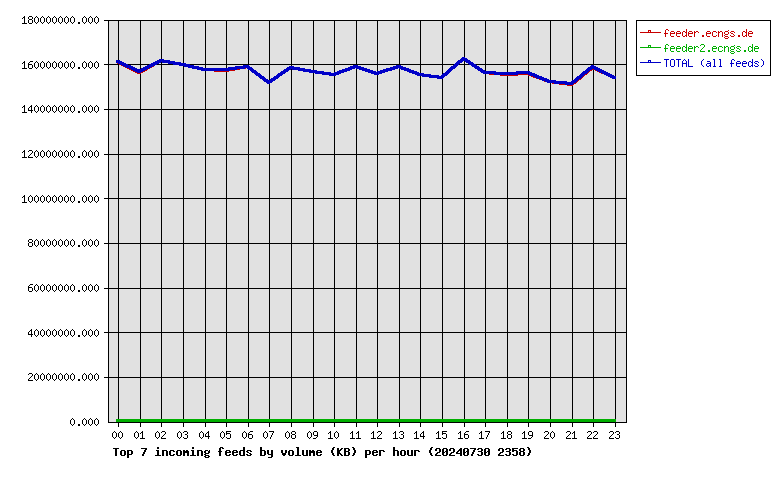
| Incoming Feed (+ Top1000 #) | Volume | %Vol | Kbps | Accepted | %Acc | %Tot | KB/art | Check | Ihave | Spam | TooOld | Rejs | Errs | ||
|---|---|---|---|---|---|---|---|---|---|---|---|---|---|---|---|
| 1 | feeder.ecngs.de | 3.50TB | 99.94 | 348073.04 | 5780487 | 95.22 | 95.61 | 650.32 | 6070303 | 0 | 0 | 0 | 192 | 0 | |
| 2 | feeder2.ecngs.de | 2.14GB | 0.06 | 207.97 | 265681 | 91.53 | 4.39 | 8.44 | 290133 | 0 | 0 | 0 | 133 | 0 | |
| Total | 3.50TB | 100.00 | 348281.02 | 6046168 | 0.00 | 100.00 | 622.12 | 6360436 | 0 | 0 | 0 | 325 | 0 | ||
 |
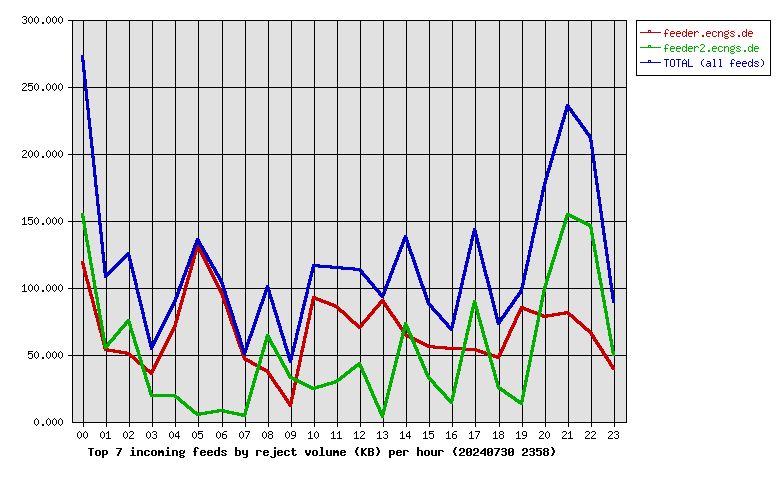
| Incoming Feed (+ Top1000 #) | Rej. Vol. | %Vol | Kbps | Accepted | %Acc | %Tot | KB/art | Check | Ihave | Spam | TooOld | Rejs | Errs | ||
|---|---|---|---|---|---|---|---|---|---|---|---|---|---|---|---|
| 1 | feeder.ecngs.de | 1.57MB | 56.73 | 0.15 | 5780487 | 95.22 | 95.61 | 650.32 | 6070303 | 0 | 0 | 0 | 192 | 0 | |
| 2 | feeder2.ecngs.de | 1.20MB | 43.27 | 0.11 | 265681 | 91.53 | 4.39 | 8.44 | 290133 | 0 | 0 | 0 | 133 | 0 | |
| Total | 2.77MB | 100.00 | 0.26 | 6046168 | 0.00 | 100.00 | 622.12 | 6360436 | 0 | 0 | 0 | 325 | 0 | ||
 |
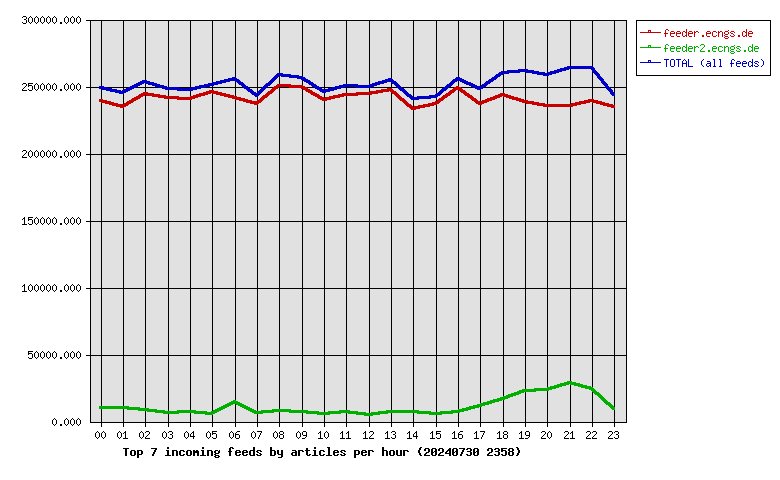
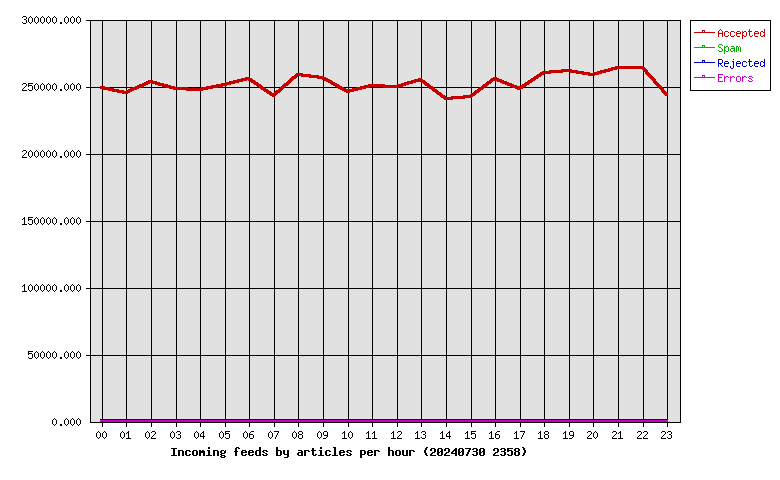
| Hour | Accepted | %Acc | Volume | %Vol | Check | Ihave | Spam | Rejs | Errs |
|---|---|---|---|---|---|---|---|---|---|
| 00 | 249233 | 4.12 | 153.50GB | 4.28 | 260851 | 0 | 0 | 19 | 0 |
| 01 | 244852 | 4.05 | 149.10GB | 4.16 | 257545 | 0 | 0 | 14 | 0 |
| 02 | 253084 | 4.19 | 153.82GB | 4.29 | 263298 | 0 | 0 | 15 | 0 |
| 03 | 248049 | 4.10 | 152.14GB | 4.24 | 254268 | 0 | 0 | 8 | 0 |
| 04 | 247645 | 4.10 | 150.27GB | 4.19 | 257343 | 0 | 0 | 7 | 0 |
| 05 | 251280 | 4.16 | 149.88GB | 4.18 | 265435 | 0 | 0 | 11 | 0 |
| 06 | 255851 | 4.23 | 151.27GB | 4.22 | 272471 | 0 | 0 | 17 | 0 |
| 07 | 243110 | 4.02 | 144.73GB | 4.03 | 250942 | 0 | 0 | 7 | 0 |
| 08 | 258332 | 4.27 | 150.80GB | 4.20 | 267413 | 0 | 0 | 12 | 0 |
| 09 | 256306 | 4.24 | 149.28GB | 4.16 | 263952 | 0 | 0 | 7 | 0 |
| 10 | 245539 | 4.06 | 148.15GB | 4.13 | 252061 | 0 | 0 | 10 | 0 |
| 11 | 250583 | 4.14 | 151.24GB | 4.22 | 258262 | 0 | 0 | 12 | 0 |
| 12 | 249718 | 4.13 | 148.38GB | 4.14 | 255435 | 0 | 0 | 10 | 0 |
| 13 | 254613 | 4.21 | 151.55GB | 4.22 | 262673 | 0 | 0 | 9 | 0 |
| 14 | 240650 | 3.98 | 148.08GB | 4.13 | 248781 | 0 | 0 | 11 | 0 |
| 15 | 242279 | 4.01 | 146.77GB | 4.09 | 247785 | 0 | 0 | 8 | 0 |
| 16 | 255625 | 4.23 | 154.96GB | 4.32 | 264357 | 0 | 0 | 5 | 0 |
| 17 | 248164 | 4.10 | 149.00GB | 4.15 | 260905 | 0 | 0 | 17 | 0 |
| 18 | 260056 | 4.30 | 148.29GB | 4.13 | 279087 | 0 | 0 | 12 | 0 |
| 19 | 261235 | 4.32 | 148.72GB | 4.15 | 288069 | 0 | 0 | 17 | 0 |
| 20 | 258612 | 4.28 | 145.16GB | 4.05 | 285325 | 0 | 0 | 22 | 0 |
| 21 | 263895 | 4.36 | 144.03GB | 4.02 | 294569 | 0 | 0 | 28 | 0 |
| 22 | 263783 | 4.36 | 151.18GB | 4.21 | 295450 | 0 | 0 | 35 | 0 |
| 23 | 243674 | 4.03 | 146.86GB | 4.09 | 254159 | 0 | 0 | 12 | 0 |
| Total | 6046168 | 100.00 | 3.50TB | 100.00 | 6360436 | 0 | 0 | 325 | 0 |
 |
| Outgoing Feed (+ Top1000 #) | Accepted | %Acc | %Tot | Art/sec | Volume | %Vol | KB/art | Dups | Rejs | % Ratio (Out/In) | ||
|---|---|---|---|---|---|---|---|---|---|---|---|---|
| 1 | 217.73.144.40 | 0 | 0.00 | 0.00 | 0.00 | 0.00KB | 0.00 | 0.00 | 5971848 | 0 | … | |
| Total | 0 | 0.00 | 0.00 | 0.00 | 0.00KB | 0.00 | 0.00 | 5971848 | 0 | |||
 |
| Outgoing Feed (+ Top1000 #) | Volume | %Vol | Kbps | Accepted | %Acc | %Tot | KB/art | Dups | Rejs | % Ratio (Out/In) | ||
|---|---|---|---|---|---|---|---|---|---|---|---|---|
| 1 | 217.73.144.40 | 0.00KB | 0.00 | 0.00 | 0 | 0.00 | 0.00 | 0.00 | 5971848 | 0 | … | |
| Total | 0.00KB | 0.00 | 0.00 | 0 | 0.00 | 0.00 | 0.00 | 5971848 | 0 | |||
 |
| Outgoing Feed (+ Top1000 #) | Rej. Vol. | %Vol | Kbps | Accepted | %Acc | %Tot | KB/art | Dups | Rejs | % Ratio (Out/In) | ||
|---|---|---|---|---|---|---|---|---|---|---|---|---|
| 1 | 217.73.144.40 | 0.00KB | 0.00 | 0.00 | 0 | 0.00 | 0.00 | 0.00 | 5971848 | 0 | … | |
| Total | 0.00KB | 0.00 | 0.00 | 0 | 0.00 | 0.00 | 0.00 | 5971848 | 0 | |||
 |
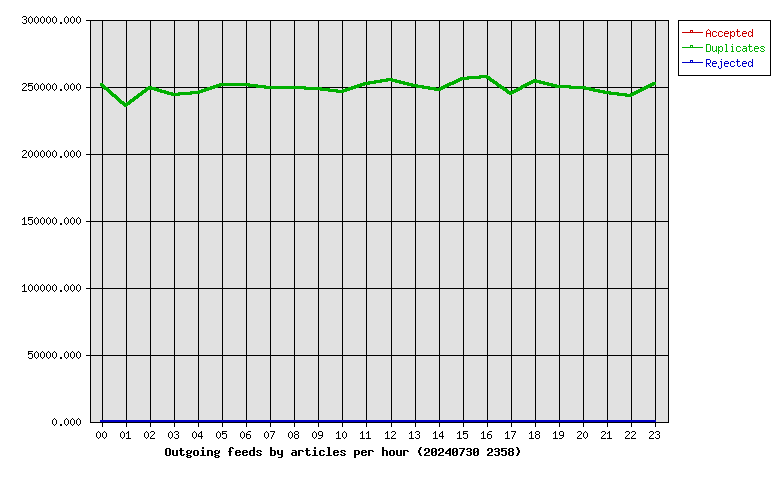
| Hour | Accepted | %Acc | Volume | %Vol | dups | Rejs |
|---|---|---|---|---|---|---|
| 00 | 0 | 0.00 | 0.00KB | 0.00 | 250951 | 0 |
| 01 | 0 | 0.00 | 0.00KB | 0.00 | 235270 | 0 |
| 02 | 0 | 0.00 | 0.00KB | 0.00 | 249188 | 0 |
| 03 | 0 | 0.00 | 0.00KB | 0.00 | 243976 | 0 |
| 04 | 0 | 0.00 | 0.00KB | 0.00 | 244964 | 0 |
| 05 | 0 | 0.00 | 0.00KB | 0.00 | 251456 | 0 |
| 06 | 0 | 0.00 | 0.00KB | 0.00 | 251080 | 0 |
| 07 | 0 | 0.00 | 0.00KB | 0.00 | 248588 | 0 |
| 08 | 0 | 0.00 | 0.00KB | 0.00 | 248907 | 0 |
| 09 | 0 | 0.00 | 0.00KB | 0.00 | 248415 | 0 |
| 10 | 0 | 0.00 | 0.00KB | 0.00 | 245996 | 0 |
| 11 | 0 | 0.00 | 0.00KB | 0.00 | 251891 | 0 |
| 12 | 0 | 0.00 | 0.00KB | 0.00 | 254699 | 0 |
| 13 | 0 | 0.00 | 0.00KB | 0.00 | 250718 | 0 |
| 14 | 0 | 0.00 | 0.00KB | 0.00 | 247097 | 0 |
| 15 | 0 | 0.00 | 0.00KB | 0.00 | 255472 | 0 |
| 16 | 0 | 0.00 | 0.00KB | 0.00 | 257016 | 0 |
| 17 | 0 | 0.00 | 0.00KB | 0.00 | 244638 | 0 |
| 18 | 0 | 0.00 | 0.00KB | 0.00 | 254036 | 0 |
| 19 | 0 | 0.00 | 0.00KB | 0.00 | 249304 | 0 |
| 20 | 0 | 0.00 | 0.00KB | 0.00 | 248950 | 0 |
| 21 | 0 | 0.00 | 0.00KB | 0.00 | 244920 | 0 |
| 22 | 0 | 0.00 | 0.00KB | 0.00 | 242735 | 0 |
| 23 | 0 | 0.00 | 0.00KB | 0.00 | 251581 | 0 |
| Total | 0 | 0.00 | 0.00KB | 0.00 | 5971848 | 0 |
 |
| >= 20% Full | >= 35% Full | >= 50% Full | >= 65% Full | >= 80% Full | >= 95% Full |
| Outgoing Feed | Batch Seq | Batch Num | Batch Max | %Full | Av. Pending |
|---|---|---|---|---|---|
| nbr.elbracht.net-o | 973663-973744 | 81 | 500 | 16 | 0.0 |
| text-spool-out | 0-0 | 0 | 500 | 0 | 0.0 |
| 1st Time | Last Time | # Msgs | Message |
|---|---|---|---|
| 13:44:14 | 13:44:21 | 3 | DNS Fwd/Rev mismatch: lookup of scanner-25.ch1.censys-scanner.com failed |