| |
DIABLO statistics for newsfeed.yoursite.com on Mon 29 Jul 2024 |
Generated on 20240729 2358 by feeder-stats v4.006. Copyright © 2002 The Diablo Project.
Diablo running processes:  81    Dnewslink running processes:  0


11:59PM  up 162 days,  7:18, 0 users, load averages: 1.36, 0.72, 0.60

Filesystem     Size    Used   Avail Capacity  Mounted on
/dev/da0s1g     94G    1.2G     85G     1%    /news
/dev/da1       7.3T    6.6T    108G    98%    /news2/spool/news/00
/dev/da2       7.3T    6.6T    107G    98%    /news2/spool/news/01
/dev/da3       3.7T    3.2T    112G    97%    /news2/spool/news/02
/dev/da4       5.5T      5T     81G    98%    /news2/spool/news/03
/dev/da8       7.3T    6.6T    108G    98%    /news2/spool/news/04
/dev/da9       7.3T    6.6T    106G    98%    /news2/spool/news/05
/dev/da10      7.3T    6.6T    105G    98%    /news2/spool/news/06
/dev/da11      5.5T    4.9T    109G    98%    /news2/spool/news/07
/dev/da12      5.5T      5T     77G    99%    /news2/spool/news/08
/dev/da13      7.3T    6.6T    103G    98%    /news2/spool/news/09
/dev/da14      7.3T    6.6T    102G    98%    /news2/spool/news/10
/dev/da15      7.3T    6.6T    101G    99%    /news2/spool/news/11
/dev/da16      7.3T    6.6T    107G    98%    /news2/spool/news/12
/dev/da17      7.3T    6.6T    105G    98%    /news2/spool/news/13
/dev/da18      7.3T    6.6T    108G    98%    /news2/spool/news/14
/dev/da19      7.3T    6.6T    103G    98%    /news2/spool/news/15
/dev/da20      7.3T    6.6T    103G    98%    /news2/spool/news/16
/dev/da21      7.3T    6.6T    102G    99%    /news2/spool/news/17
/dev/da22      7.3T    6.6T    105G    98%    /news2/spool/news/18
/dev/da23      7.3T    6.6T    105G    98%    /news2/spool/news/19
/dev/da24      7.3T    6.6T    107G    98%    /news2/spool/news/20
/dev/da25      7.3T    6.6T    104G    98%    /news2/spool/news/21
/dev/da26      7.3T    6.6T    106G    98%    /news2/spool/news/22
/dev/da5       221G     35G    168G    17%    /news1
/dev/md0        40G     13G     22G    38%    /news3
| Incoming Feed (+ Top1000 #) | Accepted | %Acc | %Tot | Art/sec | Volume | %Vol | KB/art | Check | Ihave | Spam | TooOld | Rejs | Errs | ||
|---|---|---|---|---|---|---|---|---|---|---|---|---|---|---|---|
| 1 | feeder.ecngs.de | 5712402 | 96.31 | 96.60 | 66.12 | 3.47TB | 99.95 | 651.75 | 5931067 | 0 | 0 | 0 | 152 | 0 | |
| 2 | feeder2.ecngs.de | 200878 | 91.29 | 3.40 | 2.33 | 1.70GB | 0.05 | 8.86 | 219959 | 0 | 0 | 0 | 96 | 0 | |
| Total | 5913280 | 0.00 | 100.00 | 68.44 | 3.47TB | 100.00 | 629.91 | 6151026 | 0 | 0 | 0 | 248 | 0 | ||
 |
| Incoming Feed (+ Top1000 #) | Volume | %Vol | Kbps | Accepted | %Acc | %Tot | KB/art | Check | Ihave | Spam | TooOld | Rejs | Errs | ||
|---|---|---|---|---|---|---|---|---|---|---|---|---|---|---|---|
| 1 | feeder.ecngs.de | 3.47TB | 99.95 | 344725.82 | 5712402 | 96.31 | 96.60 | 651.75 | 5931067 | 0 | 0 | 0 | 152 | 0 | |
| 2 | feeder2.ecngs.de | 1.70GB | 0.05 | 164.89 | 200878 | 91.29 | 3.40 | 8.86 | 219959 | 0 | 0 | 0 | 96 | 0 | |
| Total | 3.47TB | 100.00 | 344890.71 | 5913280 | 0.00 | 100.00 | 629.91 | 6151026 | 0 | 0 | 0 | 248 | 0 | ||
 |
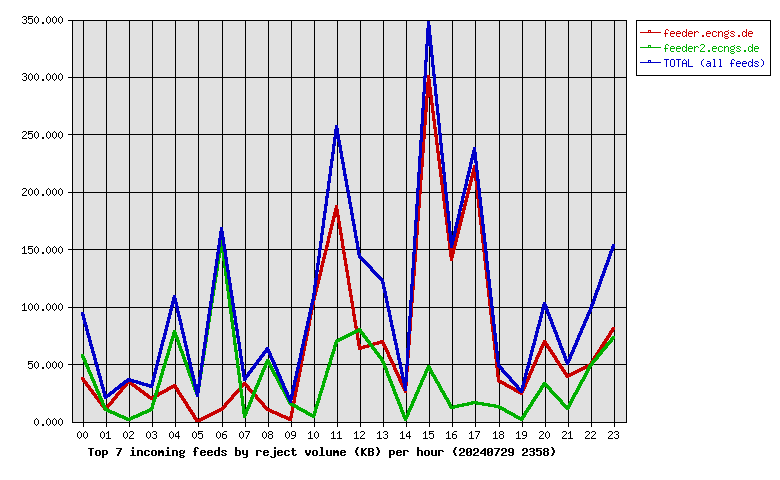
| Incoming Feed (+ Top1000 #) | Rej. Vol. | %Vol | Kbps | Accepted | %Acc | %Tot | KB/art | Check | Ihave | Spam | TooOld | Rejs | Errs | ||
|---|---|---|---|---|---|---|---|---|---|---|---|---|---|---|---|
| 1 | feeder.ecngs.de | 1.56MB | 64.69 | 0.15 | 5712402 | 96.31 | 96.60 | 651.75 | 5931067 | 0 | 0 | 0 | 152 | 0 | |
| 2 | feeder2.ecngs.de | 870.36KB | 35.31 | 0.08 | 200878 | 91.29 | 3.40 | 8.86 | 219959 | 0 | 0 | 0 | 96 | 0 | |
| Total | 2.41MB | 100.00 | 0.23 | 5913280 | 0.00 | 100.00 | 629.91 | 6151026 | 0 | 0 | 0 | 248 | 0 | ||
 |
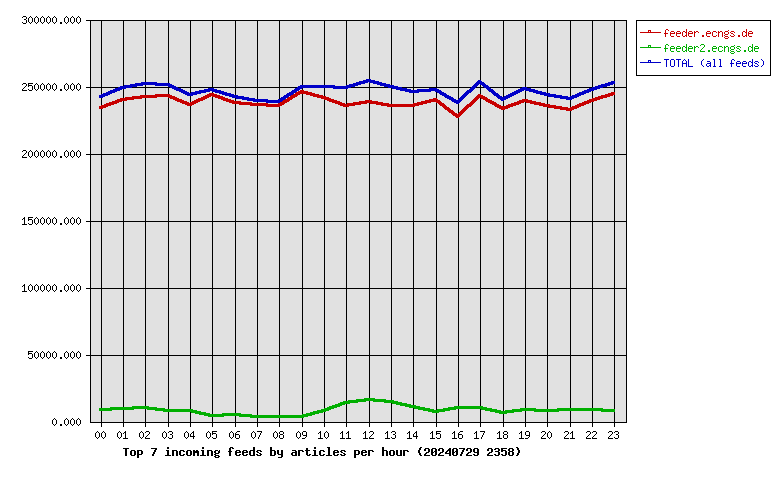
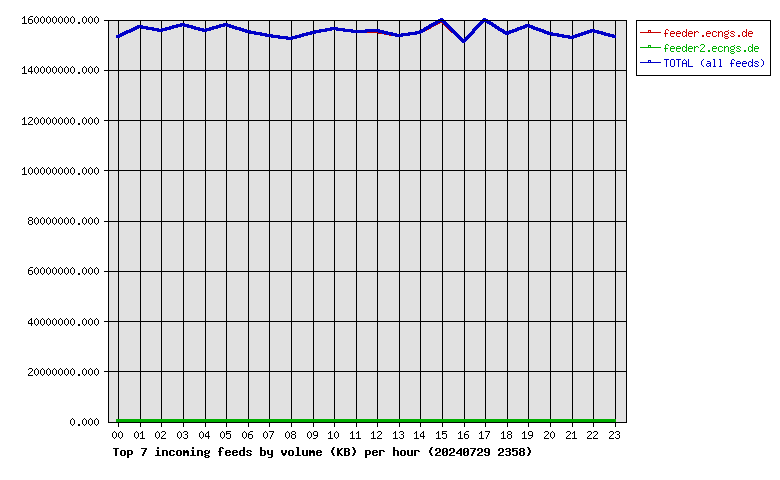
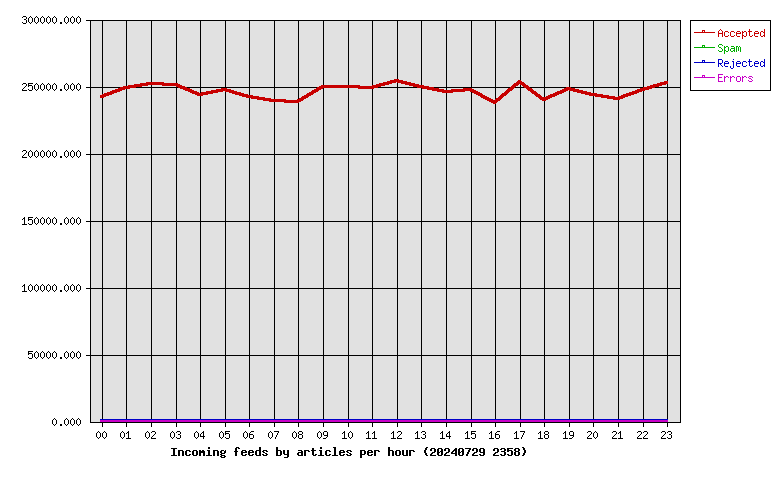
| Hour | Accepted | %Acc | Volume | %Vol | Check | Ihave | Spam | Rejs | Errs |
|---|---|---|---|---|---|---|---|---|---|
| 00 | 242123 | 4.09 | 146.05GB | 4.11 | 251853 | 0 | 0 | 13 | 0 |
| 01 | 249079 | 4.21 | 149.68GB | 4.21 | 260041 | 0 | 0 | 3 | 0 |
| 02 | 251976 | 4.26 | 148.28GB | 4.17 | 263943 | 0 | 0 | 6 | 0 |
| 03 | 250993 | 4.24 | 150.46GB | 4.24 | 259181 | 0 | 0 | 4 | 0 |
| 04 | 243431 | 4.12 | 148.40GB | 4.18 | 252851 | 0 | 0 | 7 | 0 |
| 05 | 247735 | 4.19 | 150.63GB | 4.24 | 260642 | 0 | 0 | 2 | 0 |
| 06 | 242272 | 4.10 | 147.92GB | 4.16 | 247830 | 0 | 0 | 10 | 0 |
| 07 | 239103 | 4.04 | 146.35GB | 4.12 | 242423 | 0 | 0 | 5 | 0 |
| 08 | 238593 | 4.03 | 145.08GB | 4.08 | 242015 | 0 | 0 | 9 | 0 |
| 09 | 249310 | 4.22 | 147.46GB | 4.15 | 253122 | 0 | 0 | 2 | 0 |
| 10 | 249386 | 4.22 | 148.89GB | 4.19 | 258278 | 0 | 0 | 18 | 0 |
| 11 | 248708 | 4.21 | 147.93GB | 4.16 | 264137 | 0 | 0 | 22 | 0 |
| 12 | 254058 | 4.30 | 148.10GB | 4.17 | 272521 | 0 | 0 | 14 | 0 |
| 13 | 249615 | 4.22 | 146.45GB | 4.12 | 266031 | 0 | 0 | 12 | 0 |
| 14 | 245992 | 4.16 | 147.62GB | 4.16 | 258129 | 0 | 0 | 3 | 0 |
| 15 | 247027 | 4.18 | 152.27GB | 4.29 | 255561 | 0 | 0 | 21 | 0 |
| 16 | 237858 | 4.02 | 144.22GB | 4.06 | 249767 | 0 | 0 | 17 | 0 |
| 17 | 253382 | 4.28 | 152.41GB | 4.29 | 264981 | 0 | 0 | 19 | 0 |
| 18 | 239651 | 4.05 | 147.04GB | 4.14 | 247185 | 0 | 0 | 9 | 0 |
| 19 | 248326 | 4.20 | 150.08GB | 4.22 | 258150 | 0 | 0 | 4 | 0 |
| 20 | 243984 | 4.13 | 147.25GB | 4.15 | 252949 | 0 | 0 | 6 | 0 |
| 21 | 240541 | 4.07 | 145.66GB | 4.10 | 249977 | 0 | 0 | 11 | 0 |
| 22 | 247486 | 4.19 | 148.14GB | 4.17 | 256622 | 0 | 0 | 9 | 0 |
| 23 | 252651 | 4.27 | 145.88GB | 4.11 | 262837 | 0 | 0 | 22 | 0 |
| Total | 5913280 | 100.00 | 3.47TB | 100.00 | 6151026 | 0 | 0 | 248 | 0 |
 |
| Outgoing Feed (+ Top1000 #) | Accepted | %Acc | %Tot | Art/sec | Volume | %Vol | KB/art | Dups | Rejs | % Ratio (Out/In) | ||
|---|---|---|---|---|---|---|---|---|---|---|---|---|
| 1 | 217.73.144.40 | 0 | 0.00 | 0.00 | 0.00 | 0.00KB | 0.00 | 0.00 | 5941739 | 0 | … | |
| Total | 0 | 0.00 | 0.00 | 0.00 | 0.00KB | 0.00 | 0.00 | 5941739 | 0 | |||
 |
| Outgoing Feed (+ Top1000 #) | Volume | %Vol | Kbps | Accepted | %Acc | %Tot | KB/art | Dups | Rejs | % Ratio (Out/In) | ||
|---|---|---|---|---|---|---|---|---|---|---|---|---|
| 1 | 217.73.144.40 | 0.00KB | 0.00 | 0.00 | 0 | 0.00 | 0.00 | 0.00 | 5941739 | 0 | … | |
| Total | 0.00KB | 0.00 | 0.00 | 0 | 0.00 | 0.00 | 0.00 | 5941739 | 0 | |||
 |
| Outgoing Feed (+ Top1000 #) | Rej. Vol. | %Vol | Kbps | Accepted | %Acc | %Tot | KB/art | Dups | Rejs | % Ratio (Out/In) | ||
|---|---|---|---|---|---|---|---|---|---|---|---|---|
| 1 | 217.73.144.40 | 0.00KB | 0.00 | 0.00 | 0 | 0.00 | 0.00 | 0.00 | 5941739 | 0 | … | |
| Total | 0.00KB | 0.00 | 0.00 | 0 | 0.00 | 0.00 | 0.00 | 5941739 | 0 | |||
 |
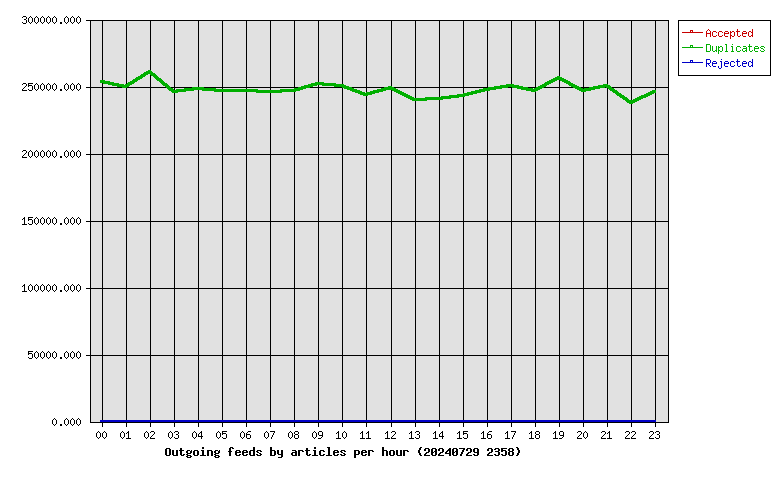
| Hour | Accepted | %Acc | Volume | %Vol | dups | Rejs |
|---|---|---|---|---|---|---|
| 00 | 0 | 0.00 | 0.00KB | 0.00 | 253370 | 0 |
| 01 | 0 | 0.00 | 0.00KB | 0.00 | 249591 | 0 |
| 02 | 0 | 0.00 | 0.00KB | 0.00 | 260792 | 0 |
| 03 | 0 | 0.00 | 0.00KB | 0.00 | 246127 | 0 |
| 04 | 0 | 0.00 | 0.00KB | 0.00 | 248107 | 0 |
| 05 | 0 | 0.00 | 0.00KB | 0.00 | 246838 | 0 |
| 06 | 0 | 0.00 | 0.00KB | 0.00 | 246377 | 0 |
| 07 | 0 | 0.00 | 0.00KB | 0.00 | 245706 | 0 |
| 08 | 0 | 0.00 | 0.00KB | 0.00 | 246810 | 0 |
| 09 | 0 | 0.00 | 0.00KB | 0.00 | 251511 | 0 |
| 10 | 0 | 0.00 | 0.00KB | 0.00 | 250471 | 0 |
| 11 | 0 | 0.00 | 0.00KB | 0.00 | 243776 | 0 |
| 12 | 0 | 0.00 | 0.00KB | 0.00 | 248811 | 0 |
| 13 | 0 | 0.00 | 0.00KB | 0.00 | 239635 | 0 |
| 14 | 0 | 0.00 | 0.00KB | 0.00 | 240455 | 0 |
| 15 | 0 | 0.00 | 0.00KB | 0.00 | 242730 | 0 |
| 16 | 0 | 0.00 | 0.00KB | 0.00 | 247078 | 0 |
| 17 | 0 | 0.00 | 0.00KB | 0.00 | 250380 | 0 |
| 18 | 0 | 0.00 | 0.00KB | 0.00 | 246427 | 0 |
| 19 | 0 | 0.00 | 0.00KB | 0.00 | 256657 | 0 |
| 20 | 0 | 0.00 | 0.00KB | 0.00 | 246571 | 0 |
| 21 | 0 | 0.00 | 0.00KB | 0.00 | 250121 | 0 |
| 22 | 0 | 0.00 | 0.00KB | 0.00 | 237319 | 0 |
| 23 | 0 | 0.00 | 0.00KB | 0.00 | 246079 | 0 |
| Total | 0 | 0.00 | 0.00KB | 0.00 | 5941739 | 0 |
 |
| >= 20% Full | >= 35% Full | >= 50% Full | >= 65% Full | >= 80% Full | >= 95% Full |
| Outgoing Feed | Batch Seq | Batch Num | Batch Max | %Full | Av. Pending |
|---|---|---|---|---|---|
| nbr.elbracht.net-o | 973375-973456 | 81 | 500 | 16 | 0.0 |
| text-spool-out | 0-0 | 0 | 500 | 0 | 0.0 |
| 1st Time | Last Time | # Msgs | Message |
|---|---|---|---|
| 06:27:41 | 1 | DNS Fwd/Rev mismatch: visit.keznews.com/194.165.16.10 |