| |
DIABLO statistics for newsfeed.yoursite.com on Sun 28 Jul 2024 |
Generated on 20240728 2358 by feeder-stats v4.006. Copyright © 2002 The Diablo Project.
Diablo running processes:  81    Dnewslink running processes:  0


11:59PM  up 161 days,  7:18, 0 users, load averages: 1.47, 0.72, 0.56

Filesystem     Size    Used   Avail Capacity  Mounted on
/dev/da0s1g     94G    1.2G     85G     1%    /news
/dev/da1       7.3T    6.6T     93G    99%    /news2/spool/news/00
/dev/da2       7.3T    6.6T     93G    99%    /news2/spool/news/01
/dev/da3       3.7T    3.3T     95G    97%    /news2/spool/news/02
/dev/da4       5.5T      5T     81G    98%    /news2/spool/news/03
/dev/da8       7.3T    6.6T     94G    99%    /news2/spool/news/04
/dev/da9       7.3T    6.6T     91G    99%    /news2/spool/news/05
/dev/da10      7.3T    6.6T     90G    99%    /news2/spool/news/06
/dev/da11      5.5T    4.9T     95G    98%    /news2/spool/news/07
/dev/da12      5.5T      5T     66G    99%    /news2/spool/news/08
/dev/da13      7.3T    6.6T     89G    99%    /news2/spool/news/09
/dev/da14      7.3T    6.6T     88G    99%    /news2/spool/news/10
/dev/da15      7.3T    6.6T     87G    99%    /news2/spool/news/11
/dev/da16      7.3T    6.6T     92G    99%    /news2/spool/news/12
/dev/da17      7.3T    6.6T     89G    99%    /news2/spool/news/13
/dev/da18      7.3T    6.6T     93G    99%    /news2/spool/news/14
/dev/da19      7.3T    6.6T     88G    99%    /news2/spool/news/15
/dev/da20      7.3T    6.6T     88G    99%    /news2/spool/news/16
/dev/da21      7.3T    6.6T     87G    99%    /news2/spool/news/17
/dev/da22      7.3T    6.6T     89G    99%    /news2/spool/news/18
/dev/da23      7.3T    6.6T     90G    99%    /news2/spool/news/19
/dev/da24      7.3T    6.6T     93G    99%    /news2/spool/news/20
/dev/da25      7.3T    6.6T     89G    99%    /news2/spool/news/21
/dev/da26      7.3T    6.6T     91G    99%    /news2/spool/news/22
/dev/da5       221G     35G    168G    17%    /news1
/dev/md0        40G     13G     22G    38%    /news3
| Incoming Feed (+ Top1000 #) | Accepted | %Acc | %Tot | Art/sec | Volume | %Vol | KB/art | Check | Ihave | Spam | TooOld | Rejs | Errs | ||
|---|---|---|---|---|---|---|---|---|---|---|---|---|---|---|---|
| 1 | feeder.ecngs.de | 5882956 | 95.68 | 95.99 | 68.09 | 3.57TB | 99.95 | 651.77 | 6148531 | 0 | 0 | 0 | 171 | 0 | |
| 2 | feeder2.ecngs.de | 245966 | 92.14 | 4.01 | 2.86 | 1.98GB | 0.05 | 8.43 | 266851 | 0 | 0 | 0 | 101 | 0 | |
| Total | 6128922 | 0.00 | 100.00 | 70.95 | 3.57TB | 100.00 | 625.95 | 6415382 | 0 | 0 | 0 | 272 | 0 | ||
 |
| Incoming Feed (+ Top1000 #) | Volume | %Vol | Kbps | Accepted | %Acc | %Tot | KB/art | Check | Ihave | Spam | TooOld | Rejs | Errs | ||
|---|---|---|---|---|---|---|---|---|---|---|---|---|---|---|---|
| 1 | feeder.ecngs.de | 3.57TB | 99.95 | 355030.37 | 5882956 | 95.68 | 95.99 | 651.77 | 6148531 | 0 | 0 | 0 | 171 | 0 | |
| 2 | feeder2.ecngs.de | 1.98GB | 0.05 | 192.94 | 245966 | 92.14 | 4.01 | 8.43 | 266851 | 0 | 0 | 0 | 101 | 0 | |
| Total | 3.57TB | 100.00 | 355223.32 | 6128922 | 0.00 | 100.00 | 625.95 | 6415382 | 0 | 0 | 0 | 272 | 0 | ||
 |
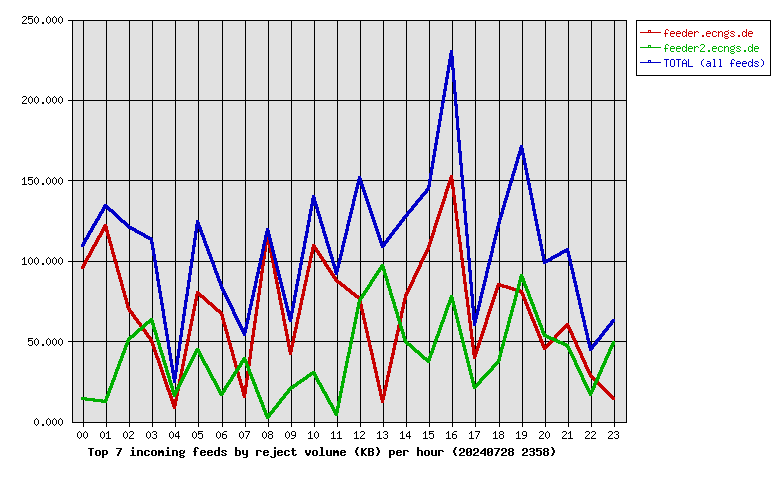
| Incoming Feed (+ Top1000 #) | Rej. Vol. | %Vol | Kbps | Accepted | %Acc | %Tot | KB/art | Check | Ihave | Spam | TooOld | Rejs | Errs | ||
|---|---|---|---|---|---|---|---|---|---|---|---|---|---|---|---|
| 1 | feeder.ecngs.de | 1.60MB | 63.08 | 0.15 | 5882956 | 95.68 | 95.99 | 651.77 | 6148531 | 0 | 0 | 0 | 171 | 0 | |
| 2 | feeder2.ecngs.de | 960.77KB | 36.92 | 0.09 | 245966 | 92.14 | 4.01 | 8.43 | 266851 | 0 | 0 | 0 | 101 | 0 | |
| Total | 2.54MB | 100.00 | 0.24 | 6128922 | 0.00 | 100.00 | 625.95 | 6415382 | 0 | 0 | 0 | 272 | 0 | ||
 |
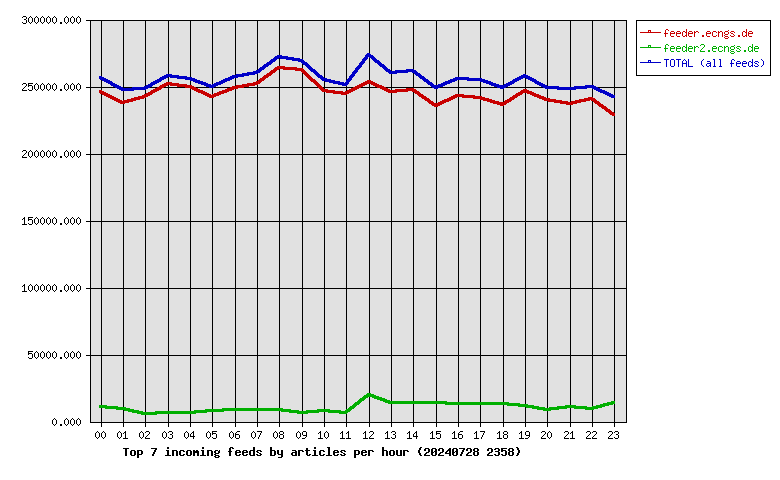
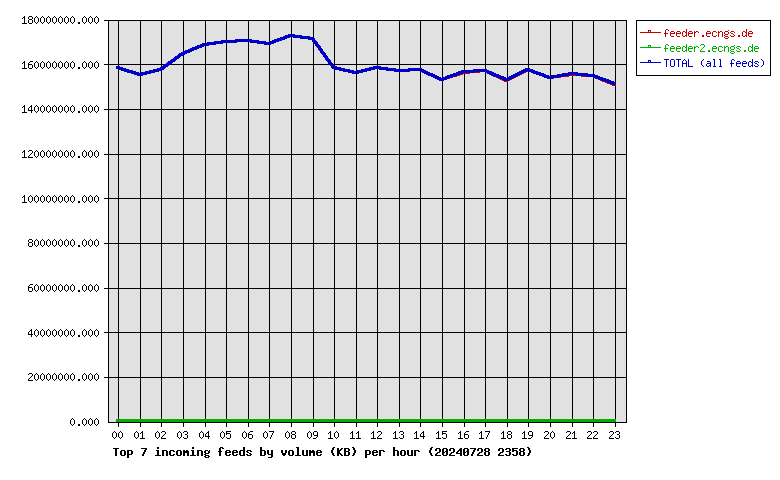
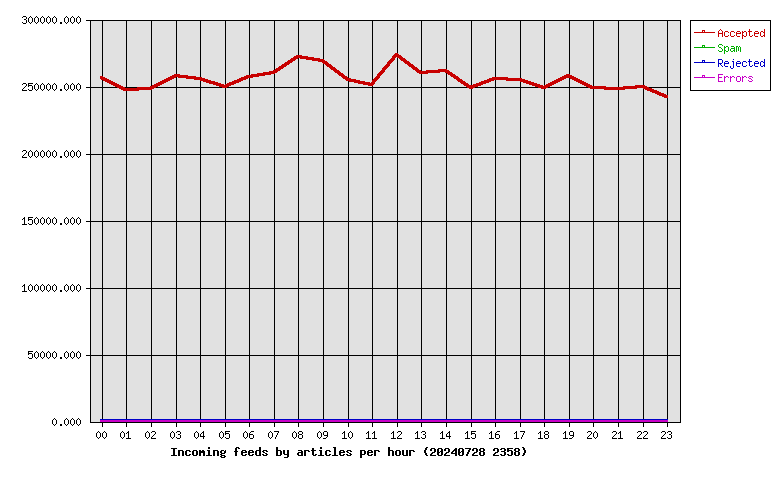
| Hour | Accepted | %Acc | Volume | %Vol | Check | Ihave | Spam | Rejs | Errs |
|---|---|---|---|---|---|---|---|---|---|
| 00 | 256654 | 4.19 | 150.88GB | 4.12 | 268817 | 0 | 0 | 18 | 0 |
| 01 | 247143 | 4.03 | 148.01GB | 4.05 | 257976 | 0 | 0 | 17 | 0 |
| 02 | 248316 | 4.05 | 150.16GB | 4.10 | 254833 | 0 | 0 | 10 | 0 |
| 03 | 257814 | 4.21 | 157.04GB | 4.29 | 264021 | 0 | 0 | 7 | 0 |
| 04 | 255927 | 4.18 | 160.84GB | 4.40 | 263388 | 0 | 0 | 5 | 0 |
| 05 | 249736 | 4.07 | 162.25GB | 4.43 | 267565 | 0 | 0 | 11 | 0 |
| 06 | 257151 | 4.20 | 162.68GB | 4.45 | 266526 | 0 | 0 | 11 | 0 |
| 07 | 259972 | 4.24 | 161.09GB | 4.40 | 269527 | 0 | 0 | 7 | 0 |
| 08 | 272207 | 4.44 | 164.63GB | 4.50 | 281549 | 0 | 0 | 11 | 0 |
| 09 | 268689 | 4.38 | 163.34GB | 4.46 | 275652 | 0 | 0 | 6 | 0 |
| 10 | 254606 | 4.15 | 150.83GB | 4.12 | 263218 | 0 | 0 | 15 | 0 |
| 11 | 251069 | 4.10 | 148.93GB | 4.07 | 258267 | 0 | 0 | 6 | 0 |
| 12 | 273704 | 4.47 | 151.14GB | 4.13 | 295345 | 0 | 0 | 15 | 0 |
| 13 | 259994 | 4.24 | 149.75GB | 4.09 | 276085 | 0 | 0 | 14 | 0 |
| 14 | 261216 | 4.26 | 150.02GB | 4.10 | 276963 | 0 | 0 | 12 | 0 |
| 15 | 249187 | 4.07 | 145.75GB | 3.98 | 262893 | 0 | 0 | 16 | 0 |
| 16 | 255818 | 4.17 | 149.09GB | 4.08 | 271957 | 0 | 0 | 16 | 0 |
| 17 | 254619 | 4.15 | 149.68GB | 4.09 | 269705 | 0 | 0 | 8 | 0 |
| 18 | 248820 | 4.06 | 145.64GB | 3.98 | 263467 | 0 | 0 | 10 | 0 |
| 19 | 257843 | 4.21 | 150.25GB | 4.11 | 270427 | 0 | 0 | 18 | 0 |
| 20 | 248973 | 4.06 | 146.86GB | 4.01 | 258956 | 0 | 0 | 13 | 0 |
| 21 | 247777 | 4.04 | 148.18GB | 4.05 | 260429 | 0 | 0 | 12 | 0 |
| 22 | 249595 | 4.07 | 147.71GB | 4.04 | 260193 | 0 | 0 | 5 | 0 |
| 23 | 242092 | 3.95 | 143.93GB | 3.93 | 257623 | 0 | 0 | 9 | 0 |
| Total | 6128922 | 100.00 | 3.57TB | 100.00 | 6415382 | 0 | 0 | 272 | 0 |
 |
| Outgoing Feed (+ Top1000 #) | Accepted | %Acc | %Tot | Art/sec | Volume | %Vol | KB/art | Dups | Rejs | % Ratio (Out/In) | ||
|---|---|---|---|---|---|---|---|---|---|---|---|---|
| 1 | 217.73.144.40 | 0 | 0.00 | 0.00 | 0.00 | 0.00KB | 0.00 | 0.00 | 6197189 | 0 | … | |
| Total | 0 | 0.00 | 0.00 | 0.00 | 0.00KB | 0.00 | 0.00 | 6197189 | 0 | |||
 |
| Outgoing Feed (+ Top1000 #) | Volume | %Vol | Kbps | Accepted | %Acc | %Tot | KB/art | Dups | Rejs | % Ratio (Out/In) | ||
|---|---|---|---|---|---|---|---|---|---|---|---|---|
| 1 | 217.73.144.40 | 0.00KB | 0.00 | 0.00 | 0 | 0.00 | 0.00 | 0.00 | 6197189 | 0 | … | |
| Total | 0.00KB | 0.00 | 0.00 | 0 | 0.00 | 0.00 | 0.00 | 6197189 | 0 | |||
 |
| Outgoing Feed (+ Top1000 #) | Rej. Vol. | %Vol | Kbps | Accepted | %Acc | %Tot | KB/art | Dups | Rejs | % Ratio (Out/In) | ||
|---|---|---|---|---|---|---|---|---|---|---|---|---|
| 1 | 217.73.144.40 | 0.00KB | 0.00 | 0.00 | 0 | 0.00 | 0.00 | 0.00 | 6197189 | 0 | … | |
| Total | 0.00KB | 0.00 | 0.00 | 0 | 0.00 | 0.00 | 0.00 | 6197189 | 0 | |||
 |
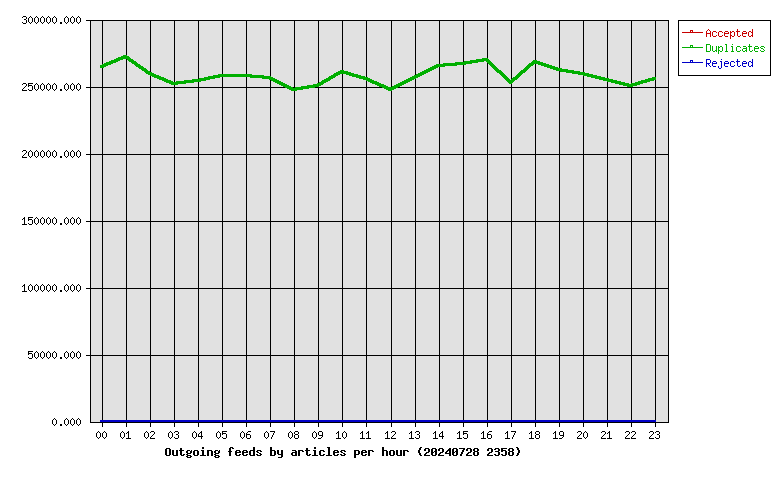
| Hour | Accepted | %Acc | Volume | %Vol | dups | Rejs |
|---|---|---|---|---|---|---|
| 00 | 0 | 0.00 | 0.00KB | 0.00 | 264212 | 0 |
| 01 | 0 | 0.00 | 0.00KB | 0.00 | 271658 | 0 |
| 02 | 0 | 0.00 | 0.00KB | 0.00 | 259167 | 0 |
| 03 | 0 | 0.00 | 0.00KB | 0.00 | 252163 | 0 |
| 04 | 0 | 0.00 | 0.00KB | 0.00 | 253798 | 0 |
| 05 | 0 | 0.00 | 0.00KB | 0.00 | 257674 | 0 |
| 06 | 0 | 0.00 | 0.00KB | 0.00 | 257798 | 0 |
| 07 | 0 | 0.00 | 0.00KB | 0.00 | 256426 | 0 |
| 08 | 0 | 0.00 | 0.00KB | 0.00 | 247503 | 0 |
| 09 | 0 | 0.00 | 0.00KB | 0.00 | 250668 | 0 |
| 10 | 0 | 0.00 | 0.00KB | 0.00 | 260703 | 0 |
| 11 | 0 | 0.00 | 0.00KB | 0.00 | 255671 | 0 |
| 12 | 0 | 0.00 | 0.00KB | 0.00 | 247678 | 0 |
| 13 | 0 | 0.00 | 0.00KB | 0.00 | 256639 | 0 |
| 14 | 0 | 0.00 | 0.00KB | 0.00 | 265609 | 0 |
| 15 | 0 | 0.00 | 0.00KB | 0.00 | 266458 | 0 |
| 16 | 0 | 0.00 | 0.00KB | 0.00 | 269699 | 0 |
| 17 | 0 | 0.00 | 0.00KB | 0.00 | 252977 | 0 |
| 18 | 0 | 0.00 | 0.00KB | 0.00 | 268270 | 0 |
| 19 | 0 | 0.00 | 0.00KB | 0.00 | 262228 | 0 |
| 20 | 0 | 0.00 | 0.00KB | 0.00 | 259381 | 0 |
| 21 | 0 | 0.00 | 0.00KB | 0.00 | 254910 | 0 |
| 22 | 0 | 0.00 | 0.00KB | 0.00 | 250111 | 0 |
| 23 | 0 | 0.00 | 0.00KB | 0.00 | 255788 | 0 |
| Total | 0 | 0.00 | 0.00KB | 0.00 | 6197189 | 0 |
 |
| >= 20% Full | >= 35% Full | >= 50% Full | >= 65% Full | >= 80% Full | >= 95% Full |
| Outgoing Feed | Batch Seq | Batch Num | Batch Max | %Full | Av. Pending |
|---|---|---|---|---|---|
| nbr.elbracht.net-o | 973087-973168 | 81 | 500 | 16 | 0.0 |
| text-spool-out | 0-0 | 0 | 500 | 0 | 0.0 |
| 1st Time | Last Time | # Msgs | Message |
|---|---|---|---|
| 12:03:41 | 1 | DNS Fwd/Rev mismatch: internettl.org/104.152.52.124 |