| |
DIABLO statistics for newsfeed.yoursite.com on Sat 27 Jul 2024 |
Generated on 20240727 2358 by feeder-stats v4.006. Copyright © 2002 The Diablo Project.
Diablo running processes:  81    Dnewslink running processes:  0


11:59PM  up 160 days,  7:18, 0 users, load averages: 1.29, 0.74, 0.63

Filesystem     Size    Used   Avail Capacity  Mounted on
/dev/da0s1g     94G    1.2G     85G     1%    /news
/dev/da1       7.3T    6.6T     77G    99%    /news2/spool/news/00
/dev/da2       7.3T    6.6T     78G    99%    /news2/spool/news/01
/dev/da3       3.7T    3.3T     86G    97%    /news2/spool/news/02
/dev/da4       5.5T      5T     74G    99%    /news2/spool/news/03
/dev/da8       7.3T    6.6T     80G    99%    /news2/spool/news/04
/dev/da9       7.3T    6.6T     77G    99%    /news2/spool/news/05
/dev/da10      7.3T    6.6T     75G    99%    /news2/spool/news/06
/dev/da11      5.5T    4.9T     94G    98%    /news2/spool/news/07
/dev/da12      5.5T    4.9T     98G    98%    /news2/spool/news/08
/dev/da13      7.3T    6.6T     74G    99%    /news2/spool/news/09
/dev/da14      7.3T    6.6T     73G    99%    /news2/spool/news/10
/dev/da15      7.3T    6.6T     73G    99%    /news2/spool/news/11
/dev/da16      7.3T    6.6T     79G    99%    /news2/spool/news/12
/dev/da17      7.3T    6.6T     75G    99%    /news2/spool/news/13
/dev/da18      7.3T    6.6T     79G    99%    /news2/spool/news/14
/dev/da19      7.3T    6.6T     73G    99%    /news2/spool/news/15
/dev/da20      7.3T    6.6T     73G    99%    /news2/spool/news/16
/dev/da21      7.3T    6.6T     73G    99%    /news2/spool/news/17
/dev/da22      7.3T    6.6T     75G    99%    /news2/spool/news/18
/dev/da23      7.3T    6.6T     74G    99%    /news2/spool/news/19
/dev/da24      7.3T    6.6T     79G    99%    /news2/spool/news/20
/dev/da25      7.3T    6.6T     75G    99%    /news2/spool/news/21
/dev/da26      7.3T    6.6T     77G    99%    /news2/spool/news/22
/dev/da5       221G     35G    168G    17%    /news1
/dev/md0        40G     13G     22G    38%    /news3
| Incoming Feed (+ Top1000 #) | Accepted | %Acc | %Tot | Art/sec | Volume | %Vol | KB/art | Check | Ihave | Spam | TooOld | Rejs | Errs | ||
|---|---|---|---|---|---|---|---|---|---|---|---|---|---|---|---|
| 1 | feeder.ecngs.de | 5965724 | 95.33 | 95.53 | 69.05 | 3.61TB | 99.94 | 649.51 | 6257794 | 0 | 0 | 0 | 211 | 0 | |
| 2 | feeder2.ecngs.de | 278868 | 90.58 | 4.47 | 3.24 | 2.06GB | 0.06 | 7.73 | 307737 | 0 | 0 | 0 | 128 | 0 | |
| Total | 6244592 | 0.00 | 100.00 | 72.29 | 3.61TB | 100.00 | 620.85 | 6565531 | 0 | 0 | 0 | 339 | 0 | ||
 |
| Incoming Feed (+ Top1000 #) | Volume | %Vol | Kbps | Accepted | %Acc | %Tot | KB/art | Check | Ihave | Spam | TooOld | Rejs | Errs | ||
|---|---|---|---|---|---|---|---|---|---|---|---|---|---|---|---|
| 1 | feeder.ecngs.de | 3.61TB | 99.94 | 358777.05 | 5965724 | 95.33 | 95.53 | 649.51 | 6257794 | 0 | 0 | 0 | 211 | 0 | |
| 2 | feeder2.ecngs.de | 2.06GB | 0.06 | 200.27 | 278868 | 90.58 | 4.47 | 7.73 | 307737 | 0 | 0 | 0 | 128 | 0 | |
| Total | 3.61TB | 100.00 | 358977.33 | 6244592 | 0.00 | 100.00 | 620.85 | 6565531 | 0 | 0 | 0 | 339 | 0 | ||
 |
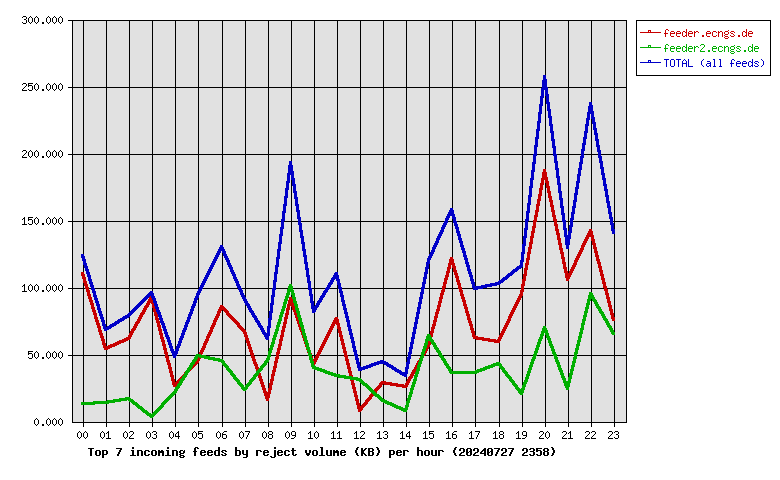
| Incoming Feed (+ Top1000 #) | Rej. Vol. | %Vol | Kbps | Accepted | %Acc | %Tot | KB/art | Check | Ihave | Spam | TooOld | Rejs | Errs | ||
|---|---|---|---|---|---|---|---|---|---|---|---|---|---|---|---|
| 1 | feeder.ecngs.de | 1.69MB | 65.48 | 0.16 | 5965724 | 95.33 | 95.53 | 649.51 | 6257794 | 0 | 0 | 0 | 211 | 0 | |
| 2 | feeder2.ecngs.de | 915.06KB | 34.52 | 0.09 | 278868 | 90.58 | 4.47 | 7.73 | 307737 | 0 | 0 | 0 | 128 | 0 | |
| Total | 2.59MB | 100.00 | 0.25 | 6244592 | 0.00 | 100.00 | 620.85 | 6565531 | 0 | 0 | 0 | 339 | 0 | ||
 |
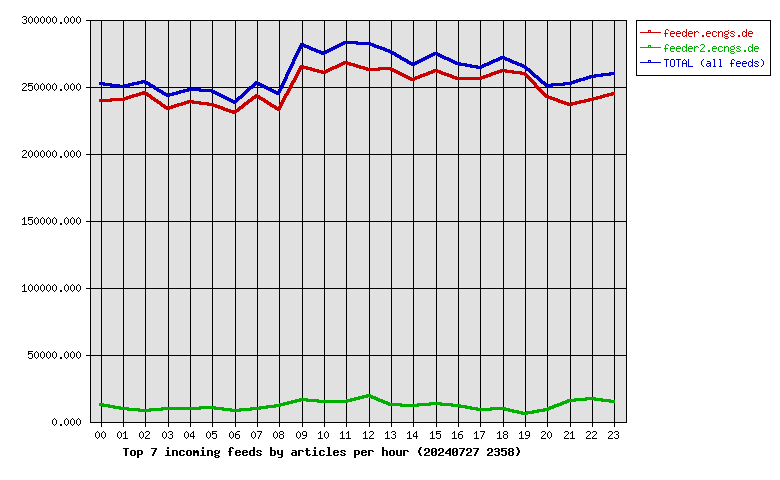
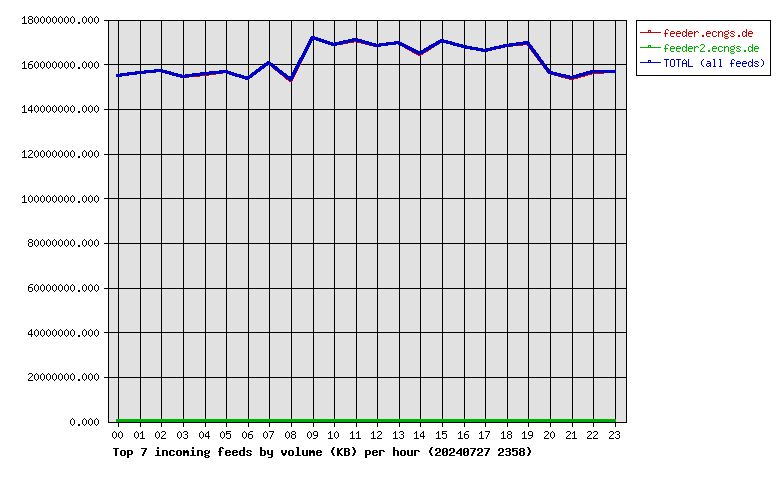
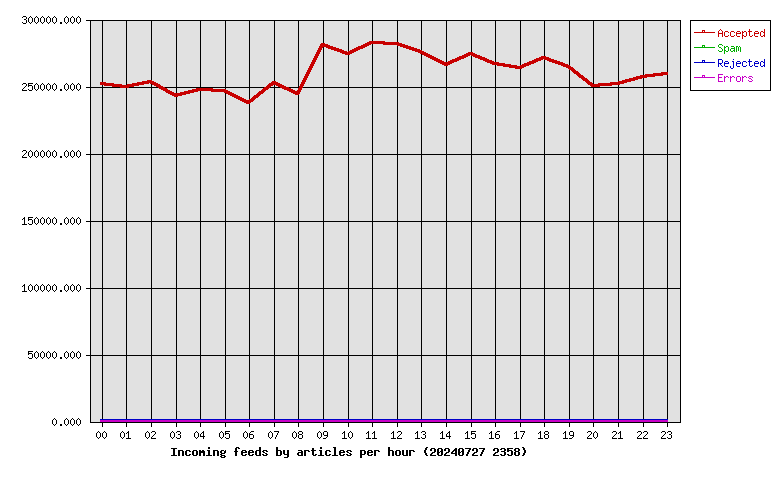
| Hour | Accepted | %Acc | Volume | %Vol | Check | Ihave | Spam | Rejs | Errs |
|---|---|---|---|---|---|---|---|---|---|
| 00 | 251568 | 4.03 | 147.45GB | 3.99 | 265336 | 0 | 0 | 16 | 0 |
| 01 | 249368 | 3.99 | 148.70GB | 4.02 | 260171 | 0 | 0 | 5 | 0 |
| 02 | 253053 | 4.05 | 149.74GB | 4.05 | 262205 | 0 | 0 | 10 | 0 |
| 03 | 242758 | 3.89 | 147.21GB | 3.98 | 252523 | 0 | 0 | 11 | 0 |
| 04 | 247589 | 3.96 | 148.20GB | 4.01 | 259142 | 0 | 0 | 8 | 0 |
| 05 | 246436 | 3.95 | 149.16GB | 4.03 | 257935 | 0 | 0 | 21 | 0 |
| 06 | 237725 | 3.81 | 146.17GB | 3.95 | 246966 | 0 | 0 | 19 | 0 |
| 07 | 252462 | 4.04 | 153.07GB | 4.14 | 263557 | 0 | 0 | 10 | 0 |
| 08 | 244434 | 3.91 | 145.63GB | 3.94 | 258022 | 0 | 0 | 6 | 0 |
| 09 | 280684 | 4.49 | 163.69GB | 4.43 | 299357 | 0 | 0 | 15 | 0 |
| 10 | 274276 | 4.39 | 160.69GB | 4.35 | 290736 | 0 | 0 | 10 | 0 |
| 11 | 282342 | 4.52 | 162.79GB | 4.40 | 299476 | 0 | 0 | 13 | 0 |
| 12 | 281446 | 4.51 | 160.42GB | 4.34 | 303416 | 0 | 0 | 13 | 0 |
| 13 | 275456 | 4.41 | 161.59GB | 4.37 | 289424 | 0 | 0 | 9 | 0 |
| 14 | 265966 | 4.26 | 156.74GB | 4.24 | 278641 | 0 | 0 | 5 | 0 |
| 15 | 274600 | 4.40 | 162.49GB | 4.39 | 288248 | 0 | 0 | 13 | 0 |
| 16 | 266603 | 4.27 | 159.80GB | 4.32 | 281609 | 0 | 0 | 16 | 0 |
| 17 | 264163 | 4.23 | 158.23GB | 4.28 | 273492 | 0 | 0 | 8 | 0 |
| 18 | 271072 | 4.34 | 160.26GB | 4.33 | 282182 | 0 | 0 | 17 | 0 |
| 19 | 264891 | 4.24 | 161.46GB | 4.37 | 271634 | 0 | 0 | 14 | 0 |
| 20 | 250217 | 4.01 | 148.94GB | 4.03 | 259435 | 0 | 0 | 20 | 0 |
| 21 | 251537 | 4.03 | 146.48GB | 3.96 | 267982 | 0 | 0 | 14 | 0 |
| 22 | 256987 | 4.12 | 149.13GB | 4.03 | 277578 | 0 | 0 | 39 | 0 |
| 23 | 258959 | 4.15 | 149.30GB | 4.04 | 276464 | 0 | 0 | 27 | 0 |
| Total | 6244592 | 100.00 | 3.61TB | 100.00 | 6565531 | 0 | 0 | 339 | 0 |
 |
| Outgoing Feed (+ Top1000 #) | Accepted | %Acc | %Tot | Art/sec | Volume | %Vol | KB/art | Dups | Rejs | % Ratio (Out/In) | ||
|---|---|---|---|---|---|---|---|---|---|---|---|---|
| 1 | 217.73.144.40 | 0 | 0.00 | 0.00 | 0.00 | 0.00KB | 0.00 | 0.00 | 6162263 | 0 | … | |
| Total | 0 | 0.00 | 0.00 | 0.00 | 0.00KB | 0.00 | 0.00 | 6162263 | 0 | |||
 |
| Outgoing Feed (+ Top1000 #) | Volume | %Vol | Kbps | Accepted | %Acc | %Tot | KB/art | Dups | Rejs | % Ratio (Out/In) | ||
|---|---|---|---|---|---|---|---|---|---|---|---|---|
| 1 | 217.73.144.40 | 0.00KB | 0.00 | 0.00 | 0 | 0.00 | 0.00 | 0.00 | 6162263 | 0 | … | |
| Total | 0.00KB | 0.00 | 0.00 | 0 | 0.00 | 0.00 | 0.00 | 6162263 | 0 | |||
 |
| Outgoing Feed (+ Top1000 #) | Rej. Vol. | %Vol | Kbps | Accepted | %Acc | %Tot | KB/art | Dups | Rejs | % Ratio (Out/In) | ||
|---|---|---|---|---|---|---|---|---|---|---|---|---|
| 1 | 217.73.144.40 | 0.00KB | 0.00 | 0.00 | 0 | 0.00 | 0.00 | 0.00 | 6162263 | 0 | … | |
| Total | 0.00KB | 0.00 | 0.00 | 0 | 0.00 | 0.00 | 0.00 | 6162263 | 0 | |||
 |
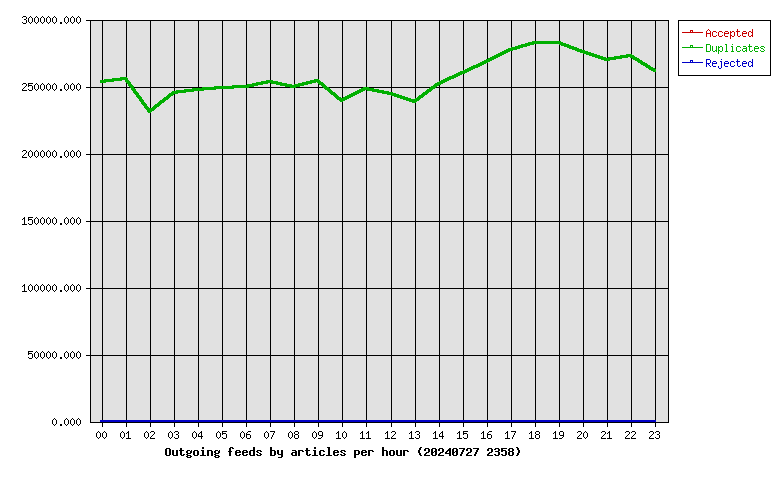
| Hour | Accepted | %Acc | Volume | %Vol | dups | Rejs |
|---|---|---|---|---|---|---|
| 00 | 0 | 0.00 | 0.00KB | 0.00 | 253277 | 0 |
| 01 | 0 | 0.00 | 0.00KB | 0.00 | 255492 | 0 |
| 02 | 0 | 0.00 | 0.00KB | 0.00 | 231200 | 0 |
| 03 | 0 | 0.00 | 0.00KB | 0.00 | 245248 | 0 |
| 04 | 0 | 0.00 | 0.00KB | 0.00 | 247286 | 0 |
| 05 | 0 | 0.00 | 0.00KB | 0.00 | 248912 | 0 |
| 06 | 0 | 0.00 | 0.00KB | 0.00 | 249937 | 0 |
| 07 | 0 | 0.00 | 0.00KB | 0.00 | 253386 | 0 |
| 08 | 0 | 0.00 | 0.00KB | 0.00 | 249569 | 0 |
| 09 | 0 | 0.00 | 0.00KB | 0.00 | 254154 | 0 |
| 10 | 0 | 0.00 | 0.00KB | 0.00 | 239425 | 0 |
| 11 | 0 | 0.00 | 0.00KB | 0.00 | 248443 | 0 |
| 12 | 0 | 0.00 | 0.00KB | 0.00 | 244656 | 0 |
| 13 | 0 | 0.00 | 0.00KB | 0.00 | 238319 | 0 |
| 14 | 0 | 0.00 | 0.00KB | 0.00 | 251731 | 0 |
| 15 | 0 | 0.00 | 0.00KB | 0.00 | 260106 | 0 |
| 16 | 0 | 0.00 | 0.00KB | 0.00 | 268636 | 0 |
| 17 | 0 | 0.00 | 0.00KB | 0.00 | 277463 | 0 |
| 18 | 0 | 0.00 | 0.00KB | 0.00 | 282415 | 0 |
| 19 | 0 | 0.00 | 0.00KB | 0.00 | 282098 | 0 |
| 20 | 0 | 0.00 | 0.00KB | 0.00 | 275781 | 0 |
| 21 | 0 | 0.00 | 0.00KB | 0.00 | 269840 | 0 |
| 22 | 0 | 0.00 | 0.00KB | 0.00 | 273115 | 0 |
| 23 | 0 | 0.00 | 0.00KB | 0.00 | 261774 | 0 |
| Total | 0 | 0.00 | 0.00KB | 0.00 | 6162263 | 0 |
 |
| >= 20% Full | >= 35% Full | >= 50% Full | >= 65% Full | >= 80% Full | >= 95% Full |
| Outgoing Feed | Batch Seq | Batch Num | Batch Max | %Full | Av. Pending |
|---|---|---|---|---|---|
| nbr.elbracht.net-o | 972799-972880 | 81 | 500 | 16 | 0.0 |
| text-spool-out | 0-0 | 0 | 500 | 0 | 0.0 |
| 1st Time | Last Time | # Msgs | Message |
|---|---|---|---|
| 02:36:25 | 02:36:39 | 3 | DNS Fwd/Rev mismatch: lookup of scanner-07.ch1.censys-scanner.com failed |
| 02:38:26 | 02:38:40 | 3 | DNS Fwd/Rev mismatch: lookup of scanner-06.ch1.censys-scanner.com failed |
| 17:06:00 | 1 | DNS Fwd/Rev mismatch: wjb.hz.zj.cn/202.107.226.2 |