| |
DIABLO statistics for newsfeed.yoursite.com on Fri 26 Jul 2024 |
Generated on 20240726 2358 by feeder-stats v4.006. Copyright © 2002 The Diablo Project.
Diablo running processes:  81    Dnewslink running processes:  0


11:59PM  up 159 days,  7:18, 0 users, load averages: 1.28, 0.79, 0.71

Filesystem     Size    Used   Avail Capacity  Mounted on
/dev/da0s1g     94G    1.2G     85G     1%    /news
/dev/da1       7.3T    6.6T     67G    99%    /news2/spool/news/00
/dev/da2       7.3T    6.6T     68G    99%    /news2/spool/news/01
/dev/da3       3.7T    3.3T     81G    98%    /news2/spool/news/02
/dev/da4       5.5T      5T     68G    99%    /news2/spool/news/03
/dev/da8       7.3T    6.6T     70G    99%    /news2/spool/news/04
/dev/da9       7.3T    6.6T     67G    99%    /news2/spool/news/05
/dev/da10      7.3T    6.6T     65G    99%    /news2/spool/news/06
/dev/da11      5.5T    4.9T     95G    98%    /news2/spool/news/07
/dev/da12      5.5T      5T     91G    98%    /news2/spool/news/08
/dev/da13      7.3T    6.6T     65G    99%    /news2/spool/news/09
/dev/da14      7.3T    6.6T     62G    99%    /news2/spool/news/10
/dev/da15      7.3T    6.6T     63G    99%    /news2/spool/news/11
/dev/da16      7.3T    6.6T     69G    99%    /news2/spool/news/12
/dev/da17      7.3T    6.6T     65G    99%    /news2/spool/news/13
/dev/da18      7.3T    6.6T     68G    99%    /news2/spool/news/14
/dev/da19      7.3T    6.6T     63G    99%    /news2/spool/news/15
/dev/da20      7.3T    6.6T     62G    99%    /news2/spool/news/16
/dev/da21      7.3T    6.6T     64G    99%    /news2/spool/news/17
/dev/da22      7.3T    6.6T     65G    99%    /news2/spool/news/18
/dev/da23      7.3T    6.6T     64G    99%    /news2/spool/news/19
/dev/da24      7.3T    6.6T     69G    99%    /news2/spool/news/20
/dev/da25      7.3T    6.6T     65G    99%    /news2/spool/news/21
/dev/da26      7.3T    6.6T     67G    99%    /news2/spool/news/22
/dev/da5       221G     35G    168G    17%    /news1
/dev/md0        40G     13G     22G    38%    /news3
| Incoming Feed (+ Top1000 #) | Accepted | %Acc | %Tot | Art/sec | Volume | %Vol | KB/art | Check | Ihave | Spam | TooOld | Rejs | Errs | ||
|---|---|---|---|---|---|---|---|---|---|---|---|---|---|---|---|
| 1 | feeder.ecngs.de | 5708100 | 95.13 | 95.48 | 66.07 | 3.53TB | 99.94 | 663.53 | 6000185 | 0 | 0 | 0 | 151 | 0 | |
| 2 | feeder2.ecngs.de | 270178 | 91.56 | 4.52 | 3.13 | 2.22GB | 0.06 | 8.62 | 294980 | 0 | 0 | 0 | 95 | 0 | |
| Total | 5978278 | 0.00 | 100.00 | 69.20 | 3.53TB | 100.00 | 633.93 | 6295165 | 0 | 0 | 0 | 246 | 0 | ||
 |
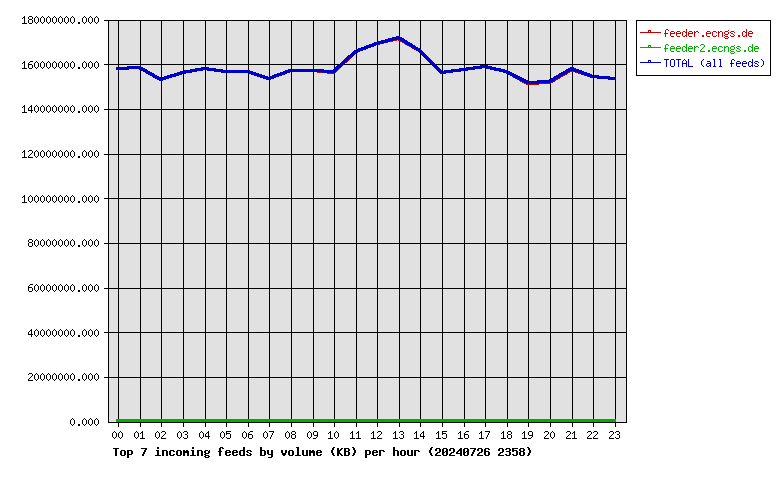
| Incoming Feed (+ Top1000 #) | Volume | %Vol | Kbps | Accepted | %Acc | %Tot | KB/art | Check | Ihave | Spam | TooOld | Rejs | Errs | ||
|---|---|---|---|---|---|---|---|---|---|---|---|---|---|---|---|
| 1 | feeder.ecngs.de | 3.53TB | 99.94 | 350692.21 | 5708100 | 95.13 | 95.48 | 663.53 | 6000185 | 0 | 0 | 0 | 151 | 0 | |
| 2 | feeder2.ecngs.de | 2.22GB | 0.06 | 216.08 | 270178 | 91.56 | 4.52 | 8.62 | 294980 | 0 | 0 | 0 | 95 | 0 | |
| Total | 3.53TB | 100.00 | 350908.29 | 5978278 | 0.00 | 100.00 | 633.93 | 6295165 | 0 | 0 | 0 | 246 | 0 | ||
 |
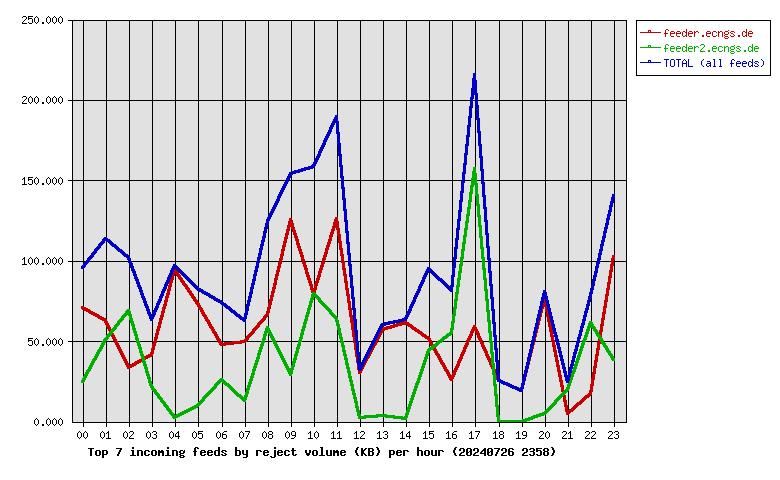
| Incoming Feed (+ Top1000 #) | Rej. Vol. | %Vol | Kbps | Accepted | %Acc | %Tot | KB/art | Check | Ihave | Spam | TooOld | Rejs | Errs | ||
|---|---|---|---|---|---|---|---|---|---|---|---|---|---|---|---|
| 1 | feeder.ecngs.de | 1.36MB | 62.63 | 0.13 | 5708100 | 95.13 | 95.48 | 663.53 | 6000185 | 0 | 0 | 0 | 151 | 0 | |
| 2 | feeder2.ecngs.de | 832.57KB | 37.37 | 0.08 | 270178 | 91.56 | 4.52 | 8.62 | 294980 | 0 | 0 | 0 | 95 | 0 | |
| Total | 2.18MB | 100.00 | 0.21 | 5978278 | 0.00 | 100.00 | 633.93 | 6295165 | 0 | 0 | 0 | 246 | 0 | ||
 |
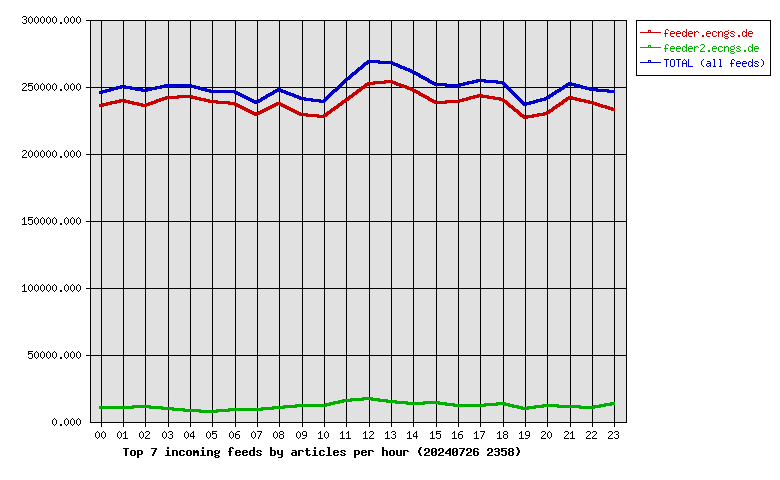
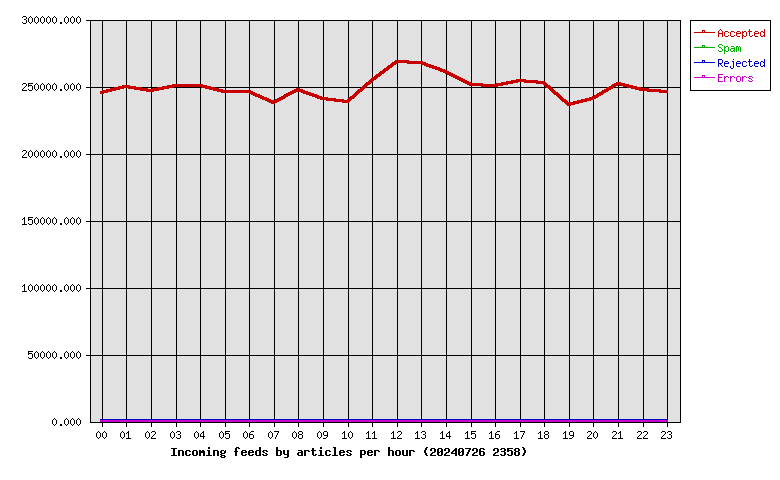
| Hour | Accepted | %Acc | Volume | %Vol | Check | Ihave | Spam | Rejs | Errs |
|---|---|---|---|---|---|---|---|---|---|
| 00 | 244998 | 4.10 | 150.70GB | 4.17 | 256169 | 0 | 0 | 12 | 0 |
| 01 | 249511 | 4.17 | 151.00GB | 4.18 | 260910 | 0 | 0 | 10 | 0 |
| 02 | 246380 | 4.12 | 145.79GB | 4.03 | 258911 | 0 | 0 | 17 | 0 |
| 03 | 250654 | 4.19 | 148.96GB | 4.12 | 259874 | 0 | 0 | 7 | 0 |
| 04 | 250071 | 4.18 | 150.74GB | 4.17 | 260203 | 0 | 0 | 11 | 0 |
| 05 | 245845 | 4.11 | 149.25GB | 4.13 | 263345 | 0 | 0 | 12 | 0 |
| 06 | 245686 | 4.11 | 149.34GB | 4.13 | 254840 | 0 | 0 | 8 | 0 |
| 07 | 237323 | 3.97 | 146.35GB | 4.05 | 247624 | 0 | 0 | 7 | 0 |
| 08 | 247275 | 4.14 | 149.54GB | 4.14 | 258742 | 0 | 0 | 7 | 0 |
| 09 | 240378 | 4.02 | 149.71GB | 4.14 | 253384 | 0 | 0 | 15 | 0 |
| 10 | 238605 | 3.99 | 149.11GB | 4.13 | 251684 | 0 | 0 | 17 | 0 |
| 11 | 254076 | 4.25 | 157.84GB | 4.37 | 270791 | 0 | 0 | 22 | 0 |
| 12 | 268459 | 4.49 | 161.18GB | 4.46 | 287752 | 0 | 0 | 3 | 0 |
| 13 | 267898 | 4.48 | 163.65GB | 4.53 | 285229 | 0 | 0 | 6 | 0 |
| 14 | 260512 | 4.36 | 158.14GB | 4.38 | 274693 | 0 | 0 | 6 | 0 |
| 15 | 251477 | 4.21 | 148.84GB | 4.12 | 266979 | 0 | 0 | 11 | 0 |
| 16 | 250480 | 4.19 | 150.04GB | 4.15 | 265080 | 0 | 0 | 10 | 0 |
| 17 | 254127 | 4.25 | 151.38GB | 4.19 | 267538 | 0 | 0 | 17 | 0 |
| 18 | 252623 | 4.23 | 149.44GB | 4.13 | 267588 | 0 | 0 | 3 | 0 |
| 19 | 235992 | 3.95 | 144.44GB | 4.00 | 246305 | 0 | 0 | 3 | 0 |
| 20 | 240549 | 4.02 | 144.79GB | 4.01 | 253573 | 0 | 0 | 14 | 0 |
| 21 | 251833 | 4.21 | 150.37GB | 4.16 | 264034 | 0 | 0 | 7 | 0 |
| 22 | 247720 | 4.14 | 147.26GB | 4.07 | 259369 | 0 | 0 | 8 | 0 |
| 23 | 245806 | 4.11 | 146.36GB | 4.05 | 260548 | 0 | 0 | 13 | 0 |
| Total | 5978278 | 100.00 | 3.53TB | 100.00 | 6295165 | 0 | 0 | 246 | 0 |
 |
| Outgoing Feed (+ Top1000 #) | Accepted | %Acc | %Tot | Art/sec | Volume | %Vol | KB/art | Dups | Rejs | % Ratio (Out/In) | ||
|---|---|---|---|---|---|---|---|---|---|---|---|---|
| 1 | 217.73.144.40 | 0 | 0.00 | 0.00 | 0.00 | 0.00KB | 0.00 | 0.00 | 6011344 | 0 | … | |
| Total | 0 | 0.00 | 0.00 | 0.00 | 0.00KB | 0.00 | 0.00 | 6011344 | 0 | |||
 |
| Outgoing Feed (+ Top1000 #) | Volume | %Vol | Kbps | Accepted | %Acc | %Tot | KB/art | Dups | Rejs | % Ratio (Out/In) | ||
|---|---|---|---|---|---|---|---|---|---|---|---|---|
| 1 | 217.73.144.40 | 0.00KB | 0.00 | 0.00 | 0 | 0.00 | 0.00 | 0.00 | 6011344 | 0 | … | |
| Total | 0.00KB | 0.00 | 0.00 | 0 | 0.00 | 0.00 | 0.00 | 6011344 | 0 | |||
 |
| Outgoing Feed (+ Top1000 #) | Rej. Vol. | %Vol | Kbps | Accepted | %Acc | %Tot | KB/art | Dups | Rejs | % Ratio (Out/In) | ||
|---|---|---|---|---|---|---|---|---|---|---|---|---|
| 1 | 217.73.144.40 | 0.00KB | 0.00 | 0.00 | 0 | 0.00 | 0.00 | 0.00 | 6011344 | 0 | … | |
| Total | 0.00KB | 0.00 | 0.00 | 0 | 0.00 | 0.00 | 0.00 | 6011344 | 0 | |||
 |
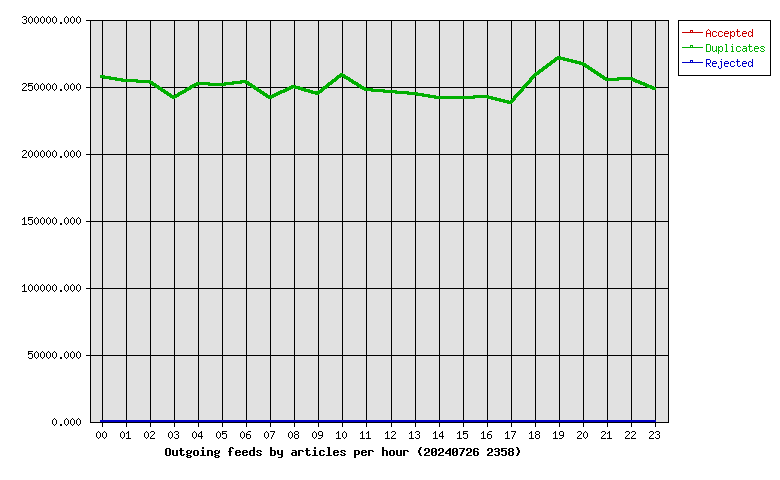
| Hour | Accepted | %Acc | Volume | %Vol | dups | Rejs |
|---|---|---|---|---|---|---|
| 00 | 0 | 0.00 | 0.00KB | 0.00 | 257177 | 0 |
| 01 | 0 | 0.00 | 0.00KB | 0.00 | 254294 | 0 |
| 02 | 0 | 0.00 | 0.00KB | 0.00 | 253575 | 0 |
| 03 | 0 | 0.00 | 0.00KB | 0.00 | 241594 | 0 |
| 04 | 0 | 0.00 | 0.00KB | 0.00 | 252026 | 0 |
| 05 | 0 | 0.00 | 0.00KB | 0.00 | 250946 | 0 |
| 06 | 0 | 0.00 | 0.00KB | 0.00 | 253016 | 0 |
| 07 | 0 | 0.00 | 0.00KB | 0.00 | 241450 | 0 |
| 08 | 0 | 0.00 | 0.00KB | 0.00 | 249665 | 0 |
| 09 | 0 | 0.00 | 0.00KB | 0.00 | 244709 | 0 |
| 10 | 0 | 0.00 | 0.00KB | 0.00 | 258578 | 0 |
| 11 | 0 | 0.00 | 0.00KB | 0.00 | 247089 | 0 |
| 12 | 0 | 0.00 | 0.00KB | 0.00 | 245847 | 0 |
| 13 | 0 | 0.00 | 0.00KB | 0.00 | 244132 | 0 |
| 14 | 0 | 0.00 | 0.00KB | 0.00 | 241099 | 0 |
| 15 | 0 | 0.00 | 0.00KB | 0.00 | 241626 | 0 |
| 16 | 0 | 0.00 | 0.00KB | 0.00 | 242133 | 0 |
| 17 | 0 | 0.00 | 0.00KB | 0.00 | 237876 | 0 |
| 18 | 0 | 0.00 | 0.00KB | 0.00 | 257944 | 0 |
| 19 | 0 | 0.00 | 0.00KB | 0.00 | 271357 | 0 |
| 20 | 0 | 0.00 | 0.00KB | 0.00 | 266967 | 0 |
| 21 | 0 | 0.00 | 0.00KB | 0.00 | 254970 | 0 |
| 22 | 0 | 0.00 | 0.00KB | 0.00 | 255450 | 0 |
| 23 | 0 | 0.00 | 0.00KB | 0.00 | 247824 | 0 |
| Total | 0 | 0.00 | 0.00KB | 0.00 | 6011344 | 0 |
 |
| >= 20% Full | >= 35% Full | >= 50% Full | >= 65% Full | >= 80% Full | >= 95% Full |
| Outgoing Feed | Batch Seq | Batch Num | Batch Max | %Full | Av. Pending |
|---|---|---|---|---|---|
| nbr.elbracht.net-o | 972511-972592 | 81 | 500 | 16 | 0.0 |
| text-spool-out | 0-0 | 0 | 500 | 0 | 0.0 |
| 1st Time | Last Time | # Msgs | Message |
|---|---|---|---|
| 00:05:44 | 00:05:45 | 3 | DNS Fwd/Rev mismatch: xunmou.cn/101.36.114.198 |