| |
DIABLO statistics for newsfeed.yoursite.com on Thu 25 Jul 2024 |
Generated on 20240725 2358 by feeder-stats v4.006. Copyright © 2002 The Diablo Project.
Diablo running processes:  81    Dnewslink running processes:  0


11:59PM  up 158 days,  7:18, 0 users, load averages: 1.19, 0.77, 0.61

Filesystem     Size    Used   Avail Capacity  Mounted on
/dev/da0s1g     94G    1.2G     85G     1%    /news
/dev/da1       7.3T    6.6T    113G    98%    /news2/spool/news/00
/dev/da2       7.3T    6.6T    115G    98%    /news2/spool/news/01
/dev/da3       3.7T    3.3T     77G    98%    /news2/spool/news/02
/dev/da4       5.5T      5T     63G    99%    /news2/spool/news/03
/dev/da8       7.3T    6.6T    117G    98%    /news2/spool/news/04
/dev/da9       7.3T    6.6T    114G    98%    /news2/spool/news/05
/dev/da10      7.3T    6.6T    112G    98%    /news2/spool/news/06
/dev/da11      5.5T      5T     89G    98%    /news2/spool/news/07
/dev/da12      5.5T      5T     81G    98%    /news2/spool/news/08
/dev/da13      7.3T    6.6T    112G    98%    /news2/spool/news/09
/dev/da14      7.3T    6.6T    109G    98%    /news2/spool/news/10
/dev/da15      7.3T    6.6T    110G    98%    /news2/spool/news/11
/dev/da16      7.3T    6.6T    114G    98%    /news2/spool/news/12
/dev/da17      7.3T    6.6T    112G    98%    /news2/spool/news/13
/dev/da18      7.3T    6.6T    114G    98%    /news2/spool/news/14
/dev/da19      7.3T    6.6T    111G    98%    /news2/spool/news/15
/dev/da20      7.3T    6.6T    108G    98%    /news2/spool/news/16
/dev/da21      7.3T    6.6T    112G    98%    /news2/spool/news/17
/dev/da22      7.3T    6.6T    111G    98%    /news2/spool/news/18
/dev/da23      7.3T    6.6T    110G    98%    /news2/spool/news/19
/dev/da24      7.3T    6.6T    116G    98%    /news2/spool/news/20
/dev/da25      7.3T    6.6T    112G    98%    /news2/spool/news/21
/dev/da26      7.3T    6.6T    113G    98%    /news2/spool/news/22
/dev/da5       221G     35G    168G    17%    /news1
/dev/md0        40G     13G     22G    38%    /news3
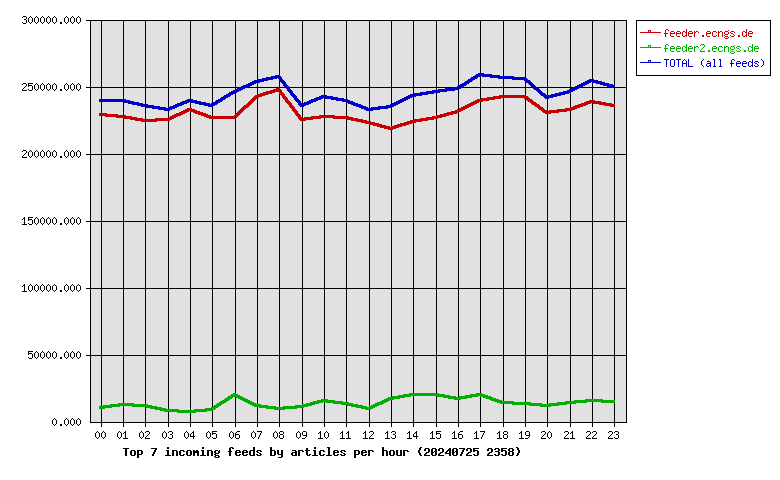
| Incoming Feed (+ Top1000 #) | Accepted | %Acc | %Tot | Art/sec | Volume | %Vol | KB/art | Check | Ihave | Spam | TooOld | Rejs | Errs | ||
|---|---|---|---|---|---|---|---|---|---|---|---|---|---|---|---|
| 1 | feeder.ecngs.de | 5538614 | 94.14 | 94.53 | 64.10 | 3.54TB | 99.93 | 685.75 | 5883179 | 0 | 0 | 0 | 194 | 0 | |
| 2 | feeder2.ecngs.de | 320557 | 91.39 | 5.47 | 3.72 | 2.45GB | 0.07 | 8.00 | 350630 | 0 | 0 | 0 | 143 | 0 | |
| Total | 5859171 | 0.00 | 100.00 | 67.82 | 3.54TB | 100.00 | 648.67 | 6233809 | 0 | 0 | 0 | 337 | 0 | ||
 |
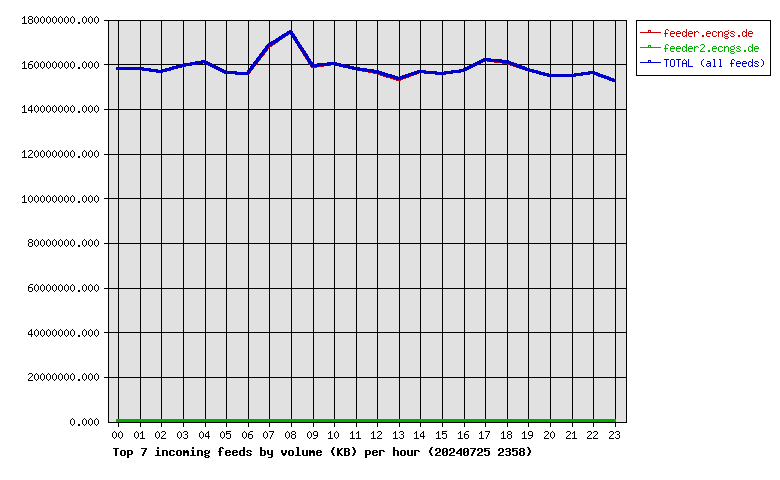
| Incoming Feed (+ Top1000 #) | Volume | %Vol | Kbps | Accepted | %Acc | %Tot | KB/art | Check | Ihave | Spam | TooOld | Rejs | Errs | ||
|---|---|---|---|---|---|---|---|---|---|---|---|---|---|---|---|
| 1 | feeder.ecngs.de | 3.54TB | 99.93 | 351674.06 | 5538614 | 94.14 | 94.53 | 685.75 | 5883179 | 0 | 0 | 0 | 194 | 0 | |
| 2 | feeder2.ecngs.de | 2.45GB | 0.07 | 238.04 | 320557 | 91.39 | 5.47 | 8.00 | 350630 | 0 | 0 | 0 | 143 | 0 | |
| Total | 3.54TB | 100.00 | 351912.10 | 5859171 | 0.00 | 100.00 | 648.67 | 6233809 | 0 | 0 | 0 | 337 | 0 | ||
 |
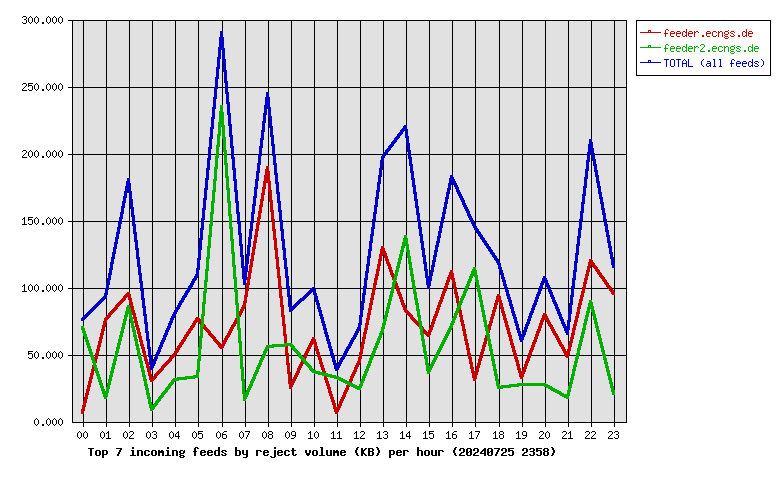
| Incoming Feed (+ Top1000 #) | Rej. Vol. | %Vol | Kbps | Accepted | %Acc | %Tot | KB/art | Check | Ihave | Spam | TooOld | Rejs | Errs | ||
|---|---|---|---|---|---|---|---|---|---|---|---|---|---|---|---|
| 1 | feeder.ecngs.de | 1.65MB | 55.82 | 0.16 | 5538614 | 94.14 | 94.53 | 685.75 | 5883179 | 0 | 0 | 0 | 194 | 0 | |
| 2 | feeder2.ecngs.de | 1.30MB | 44.18 | 0.12 | 320557 | 91.39 | 5.47 | 8.00 | 350630 | 0 | 0 | 0 | 143 | 0 | |
| Total | 2.95MB | 100.00 | 0.28 | 5859171 | 0.00 | 100.00 | 648.67 | 6233809 | 0 | 0 | 0 | 337 | 0 | ||
 |
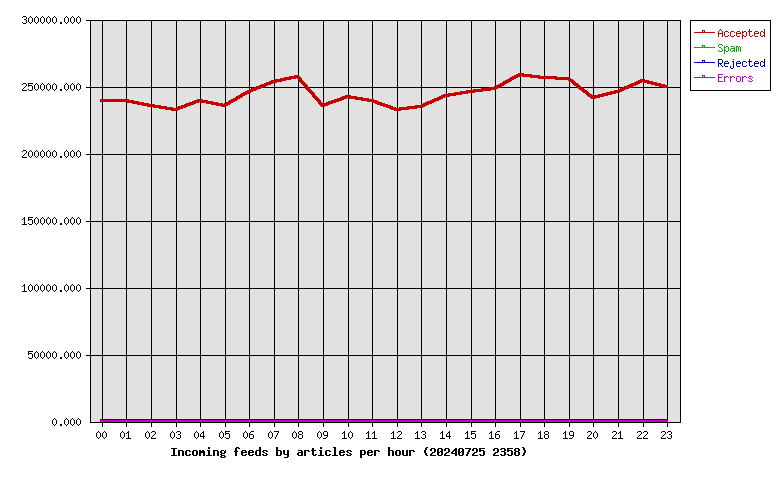
| Hour | Accepted | %Acc | Volume | %Vol | Check | Ihave | Spam | Rejs | Errs |
|---|---|---|---|---|---|---|---|---|---|
| 00 | 239300 | 4.08 | 150.61GB | 4.16 | 251104 | 0 | 0 | 7 | 0 |
| 01 | 239192 | 4.08 | 150.50GB | 4.15 | 252921 | 0 | 0 | 14 | 0 |
| 02 | 235729 | 4.02 | 149.34GB | 4.12 | 249575 | 0 | 0 | 17 | 0 |
| 03 | 232712 | 3.97 | 151.67GB | 4.18 | 241125 | 0 | 0 | 4 | 0 |
| 04 | 239451 | 4.09 | 153.37GB | 4.23 | 247834 | 0 | 0 | 11 | 0 |
| 05 | 235081 | 4.01 | 148.97GB | 4.11 | 253721 | 0 | 0 | 9 | 0 |
| 06 | 245823 | 4.20 | 148.44GB | 4.10 | 267780 | 0 | 0 | 31 | 0 |
| 07 | 253475 | 4.33 | 160.16GB | 4.42 | 267639 | 0 | 0 | 19 | 0 |
| 08 | 257284 | 4.39 | 166.52GB | 4.59 | 268393 | 0 | 0 | 21 | 0 |
| 09 | 235298 | 4.02 | 151.66GB | 4.18 | 247227 | 0 | 0 | 8 | 0 |
| 10 | 242297 | 4.14 | 152.78GB | 4.22 | 259584 | 0 | 0 | 18 | 0 |
| 11 | 239363 | 4.09 | 150.66GB | 4.16 | 254293 | 0 | 0 | 7 | 0 |
| 12 | 232307 | 3.96 | 149.09GB | 4.11 | 242721 | 0 | 0 | 8 | 0 |
| 13 | 234822 | 4.01 | 146.09GB | 4.03 | 252978 | 0 | 0 | 20 | 0 |
| 14 | 243045 | 4.15 | 149.34GB | 4.12 | 266534 | 0 | 0 | 26 | 0 |
| 15 | 245765 | 4.19 | 148.55GB | 4.10 | 266354 | 0 | 0 | 11 | 0 |
| 16 | 247781 | 4.23 | 149.62GB | 4.13 | 268538 | 0 | 0 | 17 | 0 |
| 17 | 258387 | 4.41 | 154.43GB | 4.26 | 280349 | 0 | 0 | 12 | 0 |
| 18 | 256191 | 4.37 | 153.36GB | 4.23 | 271826 | 0 | 0 | 11 | 0 |
| 19 | 255306 | 4.36 | 150.02GB | 4.14 | 269758 | 0 | 0 | 10 | 0 |
| 20 | 241506 | 4.12 | 147.64GB | 4.07 | 254616 | 0 | 0 | 12 | 0 |
| 21 | 245733 | 4.19 | 147.51GB | 4.07 | 261168 | 0 | 0 | 13 | 0 |
| 22 | 253763 | 4.33 | 148.75GB | 4.10 | 271946 | 0 | 0 | 21 | 0 |
| 23 | 249560 | 4.26 | 145.49GB | 4.01 | 265825 | 0 | 0 | 10 | 0 |
| Total | 5859171 | 100.00 | 3.54TB | 100.00 | 6233809 | 0 | 0 | 337 | 0 |
 |
| Outgoing Feed (+ Top1000 #) | Accepted | %Acc | %Tot | Art/sec | Volume | %Vol | KB/art | Dups | Rejs | % Ratio (Out/In) | ||
|---|---|---|---|---|---|---|---|---|---|---|---|---|
| 1 | 217.73.144.40 | 0 | 0.00 | 0.00 | 0.00 | 0.00KB | 0.00 | 0.00 | 5773351 | 0 | … | |
| Total | 0 | 0.00 | 0.00 | 0.00 | 0.00KB | 0.00 | 0.00 | 5773351 | 0 | |||
 |
| Outgoing Feed (+ Top1000 #) | Volume | %Vol | Kbps | Accepted | %Acc | %Tot | KB/art | Dups | Rejs | % Ratio (Out/In) | ||
|---|---|---|---|---|---|---|---|---|---|---|---|---|
| 1 | 217.73.144.40 | 0.00KB | 0.00 | 0.00 | 0 | 0.00 | 0.00 | 0.00 | 5773351 | 0 | … | |
| Total | 0.00KB | 0.00 | 0.00 | 0 | 0.00 | 0.00 | 0.00 | 5773351 | 0 | |||
 |
| Outgoing Feed (+ Top1000 #) | Rej. Vol. | %Vol | Kbps | Accepted | %Acc | %Tot | KB/art | Dups | Rejs | % Ratio (Out/In) | ||
|---|---|---|---|---|---|---|---|---|---|---|---|---|
| 1 | 217.73.144.40 | 0.00KB | 0.00 | 0.00 | 0 | 0.00 | 0.00 | 0.00 | 5773351 | 0 | … | |
| Total | 0.00KB | 0.00 | 0.00 | 0 | 0.00 | 0.00 | 0.00 | 5773351 | 0 | |||
 |
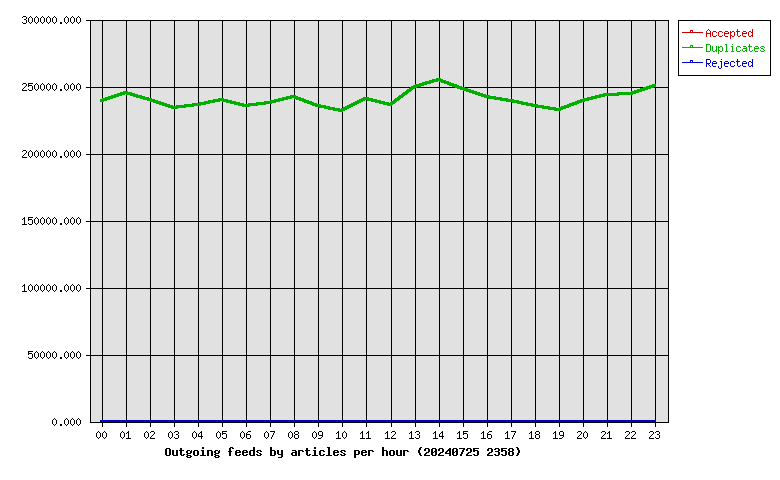
| Hour | Accepted | %Acc | Volume | %Vol | dups | Rejs |
|---|---|---|---|---|---|---|
| 00 | 0 | 0.00 | 0.00KB | 0.00 | 239110 | 0 |
| 01 | 0 | 0.00 | 0.00KB | 0.00 | 244829 | 0 |
| 02 | 0 | 0.00 | 0.00KB | 0.00 | 239602 | 0 |
| 03 | 0 | 0.00 | 0.00KB | 0.00 | 234035 | 0 |
| 04 | 0 | 0.00 | 0.00KB | 0.00 | 236054 | 0 |
| 05 | 0 | 0.00 | 0.00KB | 0.00 | 240272 | 0 |
| 06 | 0 | 0.00 | 0.00KB | 0.00 | 235343 | 0 |
| 07 | 0 | 0.00 | 0.00KB | 0.00 | 237799 | 0 |
| 08 | 0 | 0.00 | 0.00KB | 0.00 | 241891 | 0 |
| 09 | 0 | 0.00 | 0.00KB | 0.00 | 235263 | 0 |
| 10 | 0 | 0.00 | 0.00KB | 0.00 | 231741 | 0 |
| 11 | 0 | 0.00 | 0.00KB | 0.00 | 240607 | 0 |
| 12 | 0 | 0.00 | 0.00KB | 0.00 | 236475 | 0 |
| 13 | 0 | 0.00 | 0.00KB | 0.00 | 249746 | 0 |
| 14 | 0 | 0.00 | 0.00KB | 0.00 | 254560 | 0 |
| 15 | 0 | 0.00 | 0.00KB | 0.00 | 248207 | 0 |
| 16 | 0 | 0.00 | 0.00KB | 0.00 | 242356 | 0 |
| 17 | 0 | 0.00 | 0.00KB | 0.00 | 239125 | 0 |
| 18 | 0 | 0.00 | 0.00KB | 0.00 | 235610 | 0 |
| 19 | 0 | 0.00 | 0.00KB | 0.00 | 232556 | 0 |
| 20 | 0 | 0.00 | 0.00KB | 0.00 | 239225 | 0 |
| 21 | 0 | 0.00 | 0.00KB | 0.00 | 243824 | 0 |
| 22 | 0 | 0.00 | 0.00KB | 0.00 | 244713 | 0 |
| 23 | 0 | 0.00 | 0.00KB | 0.00 | 250408 | 0 |
| Total | 0 | 0.00 | 0.00KB | 0.00 | 5773351 | 0 |
 |
| >= 20% Full | >= 35% Full | >= 50% Full | >= 65% Full | >= 80% Full | >= 95% Full |
| Outgoing Feed | Batch Seq | Batch Num | Batch Max | %Full | Av. Pending |
|---|---|---|---|---|---|
| nbr.elbracht.net-o | 972223-972304 | 81 | 500 | 16 | 0.0 |
| text-spool-out | 0-0 | 0 | 500 | 0 | 0.0 |
| 1st Time | Last Time | # Msgs | Message |
|---|---|---|---|
| 14:59:14 | 14:59:22 | 3 | DNS Fwd/Rev mismatch: lookup of scanner-06.ch1.censys-scanner.com failed |