| |
DIABLO statistics for newsfeed.yoursite.com on Wed 24 Jul 2024 |
Generated on 20240724 2358 by feeder-stats v4.006. Copyright © 2002 The Diablo Project.
Diablo running processes:  81    Dnewslink running processes:  0


11:59PM  up 157 days,  7:18, 0 users, load averages: 1.40, 0.88, 0.73

Filesystem     Size    Used   Avail Capacity  Mounted on
/dev/da0s1g     94G    1.2G     85G     1%    /news
/dev/da1       7.3T    6.6T    100G    99%    /news2/spool/news/00
/dev/da2       7.3T    6.6T    102G    99%    /news2/spool/news/01
/dev/da3       3.7T    3.3T     71G    98%    /news2/spool/news/02
/dev/da4       5.5T      5T     89G    98%    /news2/spool/news/03
/dev/da8       7.3T    6.6T    104G    98%    /news2/spool/news/04
/dev/da9       7.3T    6.6T    101G    99%    /news2/spool/news/05
/dev/da10      7.3T    6.6T     98G    99%    /news2/spool/news/06
/dev/da11      5.5T      5T     77G    98%    /news2/spool/news/07
/dev/da12      5.5T      5T     71G    99%    /news2/spool/news/08
/dev/da13      7.3T    6.6T     99G    99%    /news2/spool/news/09
/dev/da14      7.3T    6.6T     97G    99%    /news2/spool/news/10
/dev/da15      7.3T    6.6T     96G    99%    /news2/spool/news/11
/dev/da16      7.3T    6.6T    102G    99%    /news2/spool/news/12
/dev/da17      7.3T    6.6T     99G    99%    /news2/spool/news/13
/dev/da18      7.3T    6.6T    102G    99%    /news2/spool/news/14
/dev/da19      7.3T    6.6T     98G    99%    /news2/spool/news/15
/dev/da20      7.3T    6.6T     95G    99%    /news2/spool/news/16
/dev/da21      7.3T    6.6T     98G    99%    /news2/spool/news/17
/dev/da22      7.3T    6.6T     97G    99%    /news2/spool/news/18
/dev/da23      7.3T    6.6T     96G    99%    /news2/spool/news/19
/dev/da24      7.3T    6.6T    103G    98%    /news2/spool/news/20
/dev/da25      7.3T    6.6T     99G    99%    /news2/spool/news/21
/dev/da26      7.3T    6.6T    100G    99%    /news2/spool/news/22
/dev/da5       221G     35G    168G    17%    /news1
/dev/md0        40G     13G     22G    38%    /news3
| Incoming Feed (+ Top1000 #) | Accepted | %Acc | %Tot | Art/sec | Volume | %Vol | KB/art | Check | Ihave | Spam | TooOld | Rejs | Errs | ||
|---|---|---|---|---|---|---|---|---|---|---|---|---|---|---|---|
| 1 | feeder.ecngs.de | 5256323 | 90.13 | 90.61 | 60.84 | 3.47TB | 99.92 | 708.74 | 5831585 | 0 | 0 | 0 | 383 | 0 | |
| 2 | feeder2.ecngs.de | 544450 | 90.49 | 9.39 | 6.33 | 2.67GB | 0.08 | 5.14 | 601329 | 0 | 0 | 0 | 343 | 0 | |
| Total | 5800773 | 0.00 | 100.00 | 67.16 | 3.47TB | 100.00 | 642.70 | 6432914 | 0 | 0 | 0 | 726 | 0 | ||
 |
| Incoming Feed (+ Top1000 #) | Volume | %Vol | Kbps | Accepted | %Acc | %Tot | KB/art | Check | Ihave | Spam | TooOld | Rejs | Errs | ||
|---|---|---|---|---|---|---|---|---|---|---|---|---|---|---|---|
| 1 | feeder.ecngs.de | 3.47TB | 99.92 | 344939.78 | 5256323 | 90.13 | 90.61 | 708.74 | 5831585 | 0 | 0 | 0 | 383 | 0 | |
| 2 | feeder2.ecngs.de | 2.67GB | 0.08 | 259.93 | 544450 | 90.49 | 9.39 | 5.14 | 601329 | 0 | 0 | 0 | 343 | 0 | |
| Total | 3.47TB | 100.00 | 345199.70 | 5800773 | 0.00 | 100.00 | 642.70 | 6432914 | 0 | 0 | 0 | 726 | 0 | ||
 |
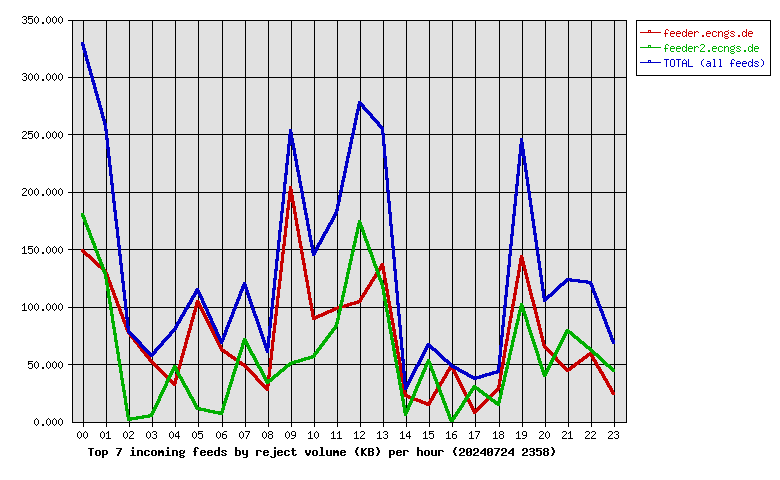
| Incoming Feed (+ Top1000 #) | Rej. Vol. | %Vol | Kbps | Accepted | %Acc | %Tot | KB/art | Check | Ihave | Spam | TooOld | Rejs | Errs | ||
|---|---|---|---|---|---|---|---|---|---|---|---|---|---|---|---|
| 1 | feeder.ecngs.de | 1.72MB | 55.90 | 0.16 | 5256323 | 90.13 | 90.61 | 708.74 | 5831585 | 0 | 0 | 0 | 383 | 0 | |
| 2 | feeder2.ecngs.de | 1.36MB | 44.10 | 0.13 | 544450 | 90.49 | 9.39 | 5.14 | 601329 | 0 | 0 | 0 | 343 | 0 | |
| Total | 3.09MB | 100.00 | 0.29 | 5800773 | 0.00 | 100.00 | 642.70 | 6432914 | 0 | 0 | 0 | 726 | 0 | ||
 |
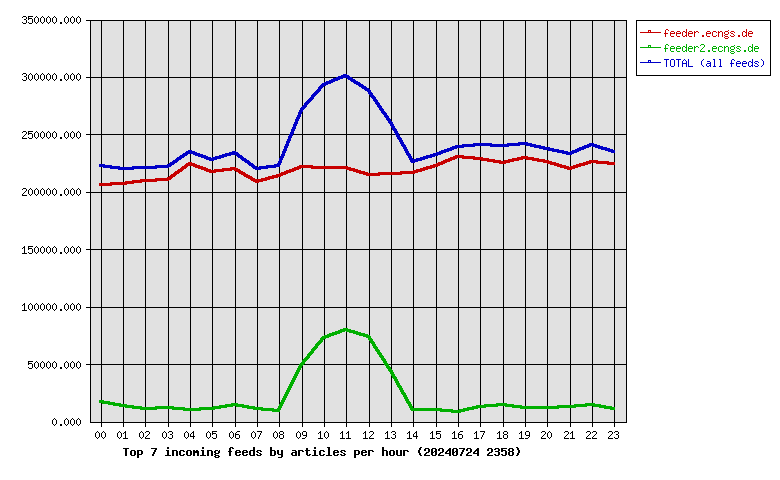
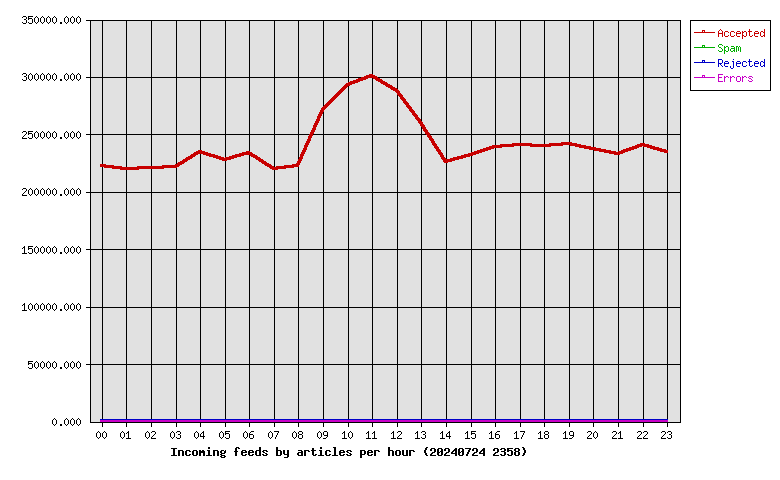
| Hour | Accepted | %Acc | Volume | %Vol | Check | Ihave | Spam | Rejs | Errs |
|---|---|---|---|---|---|---|---|---|---|
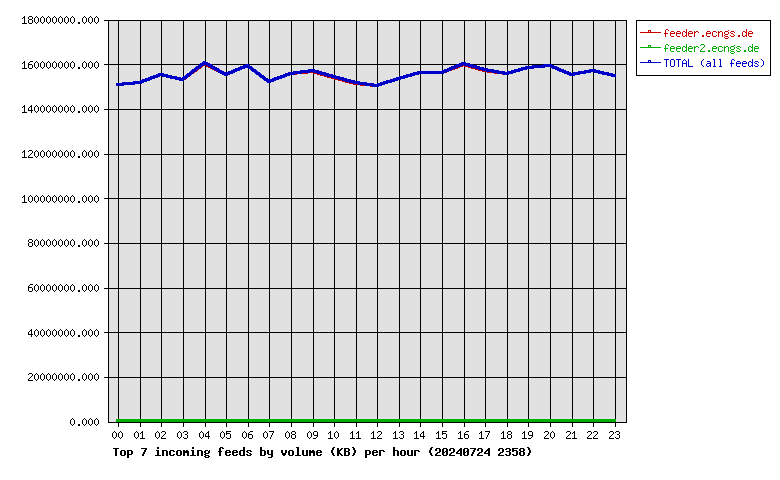
| 00 | 222802 | 3.84 | 143.69GB | 4.04 | 242284 | 0 | 0 | 29 | 0 |
| 01 | 219997 | 3.79 | 144.58GB | 4.07 | 235869 | 0 | 0 | 30 | 0 |
| 02 | 220349 | 3.80 | 147.94GB | 4.16 | 232769 | 0 | 0 | 8 | 0 |
| 03 | 221512 | 3.82 | 145.91GB | 4.10 | 232293 | 0 | 0 | 10 | 0 |
| 04 | 234617 | 4.04 | 152.89GB | 4.30 | 249348 | 0 | 0 | 8 | 0 |
| 05 | 227780 | 3.93 | 147.97GB | 4.16 | 247819 | 0 | 0 | 10 | 0 |
| 06 | 233451 | 4.02 | 151.75GB | 4.27 | 249040 | 0 | 0 | 13 | 0 |
| 07 | 219587 | 3.79 | 145.13GB | 4.08 | 232291 | 0 | 0 | 15 | 0 |
| 08 | 222843 | 3.84 | 148.43GB | 4.17 | 233963 | 0 | 0 | 13 | 0 |
| 09 | 271119 | 4.67 | 149.53GB | 4.21 | 322676 | 0 | 0 | 59 | 0 |
| 10 | 293251 | 5.06 | 146.98GB | 4.13 | 378177 | 0 | 0 | 82 | 0 |
| 11 | 300740 | 5.18 | 144.44GB | 4.06 | 390379 | 0 | 0 | 113 | 0 |
| 12 | 287871 | 4.96 | 143.46GB | 4.04 | 370552 | 0 | 0 | 121 | 0 |
| 13 | 259576 | 4.47 | 146.35GB | 4.12 | 315627 | 0 | 0 | 112 | 0 |
| 14 | 226123 | 3.90 | 149.03GB | 4.19 | 237808 | 0 | 0 | 6 | 0 |
| 15 | 232309 | 4.00 | 148.70GB | 4.18 | 243306 | 0 | 0 | 5 | 0 |
| 16 | 238681 | 4.11 | 152.51GB | 4.29 | 248844 | 0 | 0 | 5 | 0 |
| 17 | 241151 | 4.16 | 149.88GB | 4.22 | 255646 | 0 | 0 | 7 | 0 |
| 18 | 239895 | 4.14 | 148.53GB | 4.18 | 256146 | 0 | 0 | 5 | 0 |
| 19 | 241532 | 4.16 | 150.88GB | 4.24 | 255301 | 0 | 0 | 20 | 0 |
| 20 | 237354 | 4.09 | 151.90GB | 4.27 | 250464 | 0 | 0 | 15 | 0 |
| 21 | 232650 | 4.01 | 147.96GB | 4.16 | 247548 | 0 | 0 | 13 | 0 |
| 22 | 240613 | 4.15 | 149.60GB | 4.21 | 257432 | 0 | 0 | 20 | 0 |
| 23 | 234970 | 4.05 | 147.41GB | 4.15 | 247332 | 0 | 0 | 7 | 0 |
| Total | 5800773 | 100.00 | 3.47TB | 100.00 | 6432914 | 0 | 0 | 726 | 0 |
 |
| Outgoing Feed (+ Top1000 #) | Accepted | %Acc | %Tot | Art/sec | Volume | %Vol | KB/art | Dups | Rejs | % Ratio (Out/In) | ||
|---|---|---|---|---|---|---|---|---|---|---|---|---|
| 1 | 217.73.144.40 | 0 | 0.00 | 0.00 | 0.00 | 0.00KB | 0.00 | 0.00 | 5742620 | 0 | … | |
| Total | 0 | 0.00 | 0.00 | 0.00 | 0.00KB | 0.00 | 0.00 | 5742620 | 0 | |||
 |
| Outgoing Feed (+ Top1000 #) | Volume | %Vol | Kbps | Accepted | %Acc | %Tot | KB/art | Dups | Rejs | % Ratio (Out/In) | ||
|---|---|---|---|---|---|---|---|---|---|---|---|---|
| 1 | 217.73.144.40 | 0.00KB | 0.00 | 0.00 | 0 | 0.00 | 0.00 | 0.00 | 5742620 | 0 | … | |
| Total | 0.00KB | 0.00 | 0.00 | 0 | 0.00 | 0.00 | 0.00 | 5742620 | 0 | |||
 |
| Outgoing Feed (+ Top1000 #) | Rej. Vol. | %Vol | Kbps | Accepted | %Acc | %Tot | KB/art | Dups | Rejs | % Ratio (Out/In) | ||
|---|---|---|---|---|---|---|---|---|---|---|---|---|
| 1 | 217.73.144.40 | 0.00KB | 0.00 | 0.00 | 0 | 0.00 | 0.00 | 0.00 | 5742620 | 0 | … | |
| Total | 0.00KB | 0.00 | 0.00 | 0 | 0.00 | 0.00 | 0.00 | 5742620 | 0 | |||
 |
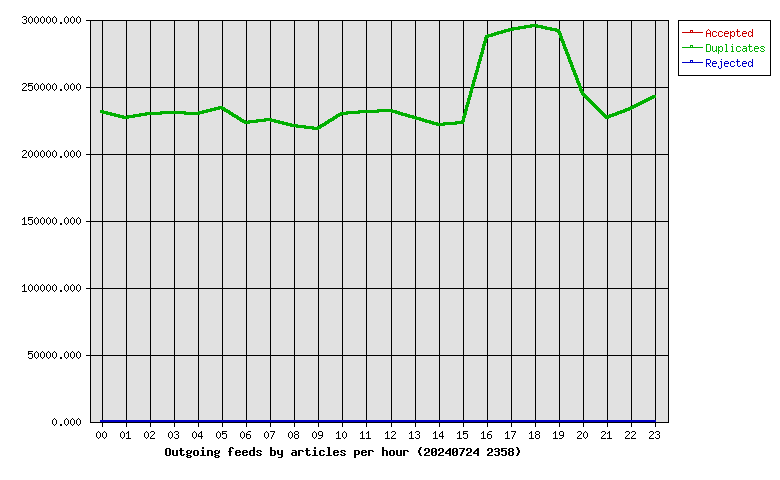
| Hour | Accepted | %Acc | Volume | %Vol | dups | Rejs |
|---|---|---|---|---|---|---|
| 00 | 0 | 0.00 | 0.00KB | 0.00 | 230838 | 0 |
| 01 | 0 | 0.00 | 0.00KB | 0.00 | 226540 | 0 |
| 02 | 0 | 0.00 | 0.00KB | 0.00 | 229383 | 0 |
| 03 | 0 | 0.00 | 0.00KB | 0.00 | 230577 | 0 |
| 04 | 0 | 0.00 | 0.00KB | 0.00 | 229252 | 0 |
| 05 | 0 | 0.00 | 0.00KB | 0.00 | 233816 | 0 |
| 06 | 0 | 0.00 | 0.00KB | 0.00 | 222421 | 0 |
| 07 | 0 | 0.00 | 0.00KB | 0.00 | 224978 | 0 |
| 08 | 0 | 0.00 | 0.00KB | 0.00 | 220807 | 0 |
| 09 | 0 | 0.00 | 0.00KB | 0.00 | 218572 | 0 |
| 10 | 0 | 0.00 | 0.00KB | 0.00 | 229587 | 0 |
| 11 | 0 | 0.00 | 0.00KB | 0.00 | 230651 | 0 |
| 12 | 0 | 0.00 | 0.00KB | 0.00 | 231612 | 0 |
| 13 | 0 | 0.00 | 0.00KB | 0.00 | 226751 | 0 |
| 14 | 0 | 0.00 | 0.00KB | 0.00 | 221140 | 0 |
| 15 | 0 | 0.00 | 0.00KB | 0.00 | 223056 | 0 |
| 16 | 0 | 0.00 | 0.00KB | 0.00 | 286965 | 0 |
| 17 | 0 | 0.00 | 0.00KB | 0.00 | 292524 | 0 |
| 18 | 0 | 0.00 | 0.00KB | 0.00 | 295188 | 0 |
| 19 | 0 | 0.00 | 0.00KB | 0.00 | 291280 | 0 |
| 20 | 0 | 0.00 | 0.00KB | 0.00 | 244576 | 0 |
| 21 | 0 | 0.00 | 0.00KB | 0.00 | 226635 | 0 |
| 22 | 0 | 0.00 | 0.00KB | 0.00 | 233259 | 0 |
| 23 | 0 | 0.00 | 0.00KB | 0.00 | 242212 | 0 |
| Total | 0 | 0.00 | 0.00KB | 0.00 | 5742620 | 0 |
 |
| >= 20% Full | >= 35% Full | >= 50% Full | >= 65% Full | >= 80% Full | >= 95% Full |
| Outgoing Feed | Batch Seq | Batch Num | Batch Max | %Full | Av. Pending |
|---|---|---|---|---|---|
| nbr.elbracht.net-o | 971935-972016 | 81 | 500 | 16 | 0.0 |
| text-spool-out | 0-0 | 0 | 500 | 0 | 0.0 |
| 1st Time | Last Time | # Msgs | Message |
|---|---|---|---|
| 06:48:32 | 06:48:39 | 3 | DNS Fwd/Rev mismatch: lookup of unused-space.coop.net failed |
| 20:24:20 | 1 | DNS Fwd/Rev mismatch: visit.keznews.com/194.165.16.72 |