| |
DIABLO statistics for newsfeed.yoursite.com on Mon 22 Jul 2024 |
Generated on 20240722 2358 by feeder-stats v4.006. Copyright © 2002 The Diablo Project.
Diablo running processes:  81    Dnewslink running processes:  0


11:59PM  up 155 days,  7:18, 0 users, load averages: 1.42, 0.81, 0.69

Filesystem     Size    Used   Avail Capacity  Mounted on
/dev/da0s1g     94G    1.2G     85G     1%    /news
/dev/da1       7.3T    6.6T     96G    99%    /news2/spool/news/00
/dev/da2       7.3T    6.6T     98G    99%    /news2/spool/news/01
/dev/da3       3.7T    3.3T     65G    98%    /news2/spool/news/02
/dev/da4       5.5T      5T     76G    99%    /news2/spool/news/03
/dev/da8       7.3T    6.6T     99G    99%    /news2/spool/news/04
/dev/da9       7.3T    6.6T     96G    99%    /news2/spool/news/05
/dev/da10      7.3T    6.6T     93G    99%    /news2/spool/news/06
/dev/da11      5.5T    4.9T    114G    98%    /news2/spool/news/07
/dev/da12      5.5T      5T     71G    99%    /news2/spool/news/08
/dev/da13      7.3T    6.6T     95G    99%    /news2/spool/news/09
/dev/da14      7.3T    6.6T     94G    99%    /news2/spool/news/10
/dev/da15      7.3T    6.6T     91G    99%    /news2/spool/news/11
/dev/da16      7.3T    6.6T     97G    99%    /news2/spool/news/12
/dev/da17      7.3T    6.6T     95G    99%    /news2/spool/news/13
/dev/da18      7.3T    6.6T     97G    99%    /news2/spool/news/14
/dev/da19      7.3T    6.6T     93G    99%    /news2/spool/news/15
/dev/da20      7.3T    6.6T     91G    99%    /news2/spool/news/16
/dev/da21      7.3T    6.6T     93G    99%    /news2/spool/news/17
/dev/da22      7.3T    6.6T     93G    99%    /news2/spool/news/18
/dev/da23      7.3T    6.6T     92G    99%    /news2/spool/news/19
/dev/da24      7.3T    6.6T     98G    99%    /news2/spool/news/20
/dev/da25      7.3T    6.6T     94G    99%    /news2/spool/news/21
/dev/da26      7.3T    6.6T     96G    99%    /news2/spool/news/22
/dev/da5       221G     35G    168G    17%    /news1
/dev/md0        40G     13G     22G    38%    /news3
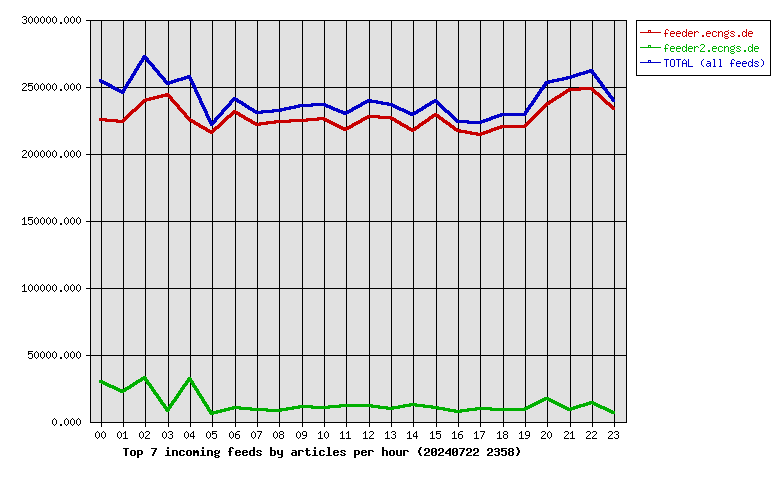
| Incoming Feed (+ Top1000 #) | Accepted | %Acc | %Tot | Art/sec | Volume | %Vol | KB/art | Check | Ihave | Spam | TooOld | Rejs | Errs | ||
|---|---|---|---|---|---|---|---|---|---|---|---|---|---|---|---|
| 1 | feeder.ecngs.de | 5450284 | 94.20 | 94.61 | 63.08 | 3.54TB | 99.93 | 697.01 | 5785824 | 0 | 0 | 0 | 196 | 0 | |
| 2 | feeder2.ecngs.de | 310433 | 90.37 | 5.39 | 3.61 | 2.43GB | 0.07 | 8.21 | 343346 | 0 | 0 | 0 | 176 | 0 | |
| Total | 5760717 | 0.00 | 100.00 | 66.69 | 3.54TB | 100.00 | 659.90 | 6129170 | 0 | 0 | 0 | 372 | 0 | ||
 |
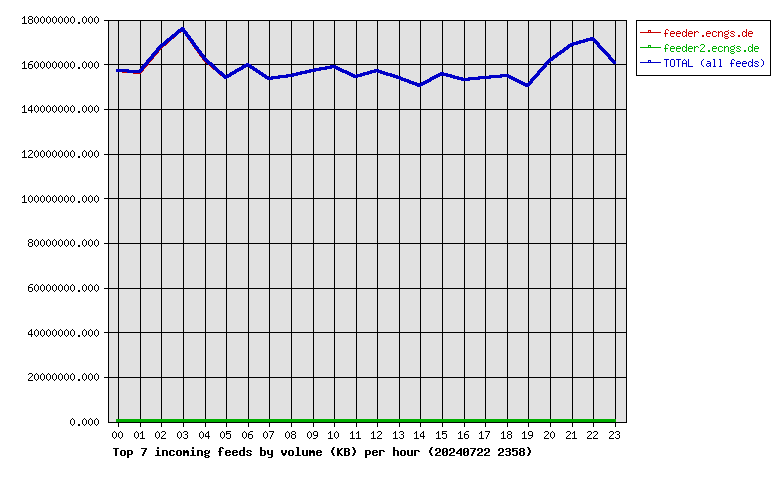
| Incoming Feed (+ Top1000 #) | Volume | %Vol | Kbps | Accepted | %Acc | %Tot | KB/art | Check | Ihave | Spam | TooOld | Rejs | Errs | ||
|---|---|---|---|---|---|---|---|---|---|---|---|---|---|---|---|
| 1 | feeder.ecngs.de | 3.54TB | 99.93 | 351752.65 | 5450284 | 94.20 | 94.61 | 697.01 | 5785824 | 0 | 0 | 0 | 196 | 0 | |
| 2 | feeder2.ecngs.de | 2.43GB | 0.07 | 237.26 | 310433 | 90.37 | 5.39 | 8.21 | 343346 | 0 | 0 | 0 | 176 | 0 | |
| Total | 3.54TB | 100.00 | 351989.91 | 5760717 | 0.00 | 100.00 | 659.90 | 6129170 | 0 | 0 | 0 | 372 | 0 | ||
 |
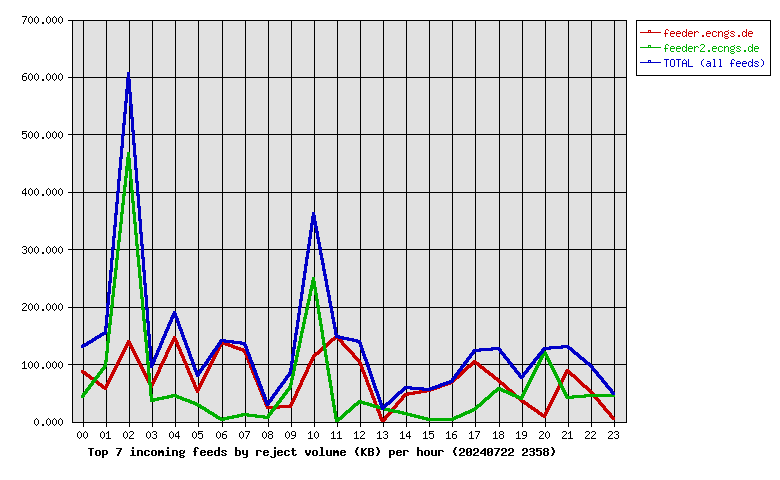
| Incoming Feed (+ Top1000 #) | Rej. Vol. | %Vol | Kbps | Accepted | %Acc | %Tot | KB/art | Check | Ihave | Spam | TooOld | Rejs | Errs | ||
|---|---|---|---|---|---|---|---|---|---|---|---|---|---|---|---|
| 1 | feeder.ecngs.de | 1.70MB | 54.00 | 0.16 | 5450284 | 94.20 | 94.61 | 697.01 | 5785824 | 0 | 0 | 0 | 196 | 0 | |
| 2 | feeder2.ecngs.de | 1.44MB | 46.00 | 0.14 | 310433 | 90.37 | 5.39 | 8.21 | 343346 | 0 | 0 | 0 | 176 | 0 | |
| Total | 3.14MB | 100.00 | 0.30 | 5760717 | 0.00 | 100.00 | 659.90 | 6129170 | 0 | 0 | 0 | 372 | 0 | ||
 |
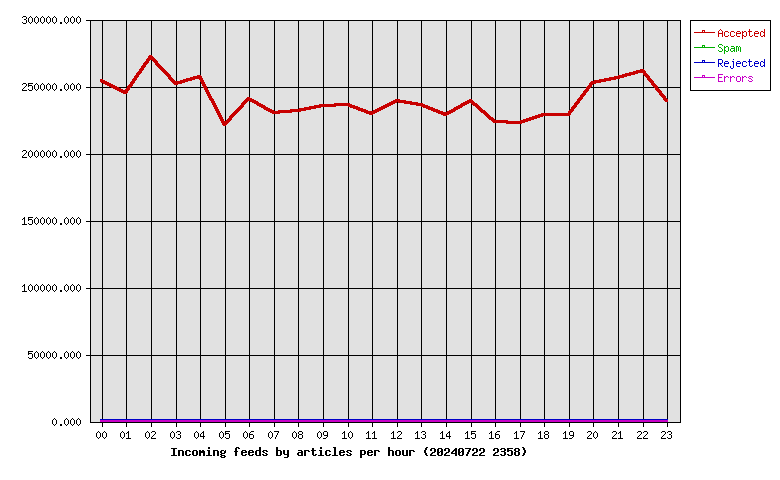
| Hour | Accepted | %Acc | Volume | %Vol | Check | Ihave | Spam | Rejs | Errs |
|---|---|---|---|---|---|---|---|---|---|
| 00 | 254122 | 4.41 | 149.81GB | 4.13 | 288487 | 0 | 0 | 31 | 0 |
| 01 | 245010 | 4.25 | 149.04GB | 4.11 | 268357 | 0 | 0 | 33 | 0 |
| 02 | 271888 | 4.72 | 159.80GB | 4.41 | 314658 | 0 | 0 | 54 | 0 |
| 03 | 251509 | 4.37 | 167.57GB | 4.62 | 259630 | 0 | 0 | 13 | 0 |
| 04 | 256889 | 4.46 | 154.59GB | 4.26 | 293545 | 0 | 0 | 27 | 0 |
| 05 | 221270 | 3.84 | 146.59GB | 4.04 | 237103 | 0 | 0 | 14 | 0 |
| 06 | 240868 | 4.18 | 152.41GB | 4.20 | 251615 | 0 | 0 | 12 | 0 |
| 07 | 230213 | 4.00 | 146.36GB | 4.04 | 240490 | 0 | 0 | 16 | 0 |
| 08 | 231538 | 4.02 | 147.55GB | 4.07 | 240486 | 0 | 0 | 7 | 0 |
| 09 | 235566 | 4.09 | 149.72GB | 4.13 | 246973 | 0 | 0 | 7 | 0 |
| 10 | 236332 | 4.10 | 151.59GB | 4.18 | 250044 | 0 | 0 | 26 | 0 |
| 11 | 229520 | 3.98 | 147.03GB | 4.06 | 243010 | 0 | 0 | 9 | 0 |
| 12 | 238922 | 4.15 | 149.88GB | 4.13 | 252073 | 0 | 0 | 10 | 0 |
| 13 | 236120 | 4.10 | 146.72GB | 4.05 | 247483 | 0 | 0 | 3 | 0 |
| 14 | 228971 | 3.97 | 143.36GB | 3.95 | 242163 | 0 | 0 | 11 | 0 |
| 15 | 239081 | 4.15 | 148.42GB | 4.09 | 249956 | 0 | 0 | 7 | 0 |
| 16 | 223157 | 3.87 | 145.73GB | 4.02 | 231484 | 0 | 0 | 6 | 0 |
| 17 | 222684 | 3.87 | 146.80GB | 4.05 | 232339 | 0 | 0 | 12 | 0 |
| 18 | 228440 | 3.97 | 147.70GB | 4.07 | 238123 | 0 | 0 | 13 | 0 |
| 19 | 228759 | 3.97 | 143.23GB | 3.95 | 240056 | 0 | 0 | 8 | 0 |
| 20 | 252409 | 4.38 | 154.00GB | 4.25 | 271046 | 0 | 0 | 14 | 0 |
| 21 | 256250 | 4.45 | 160.98GB | 4.44 | 266469 | 0 | 0 | 21 | 0 |
| 22 | 261775 | 4.54 | 163.53GB | 4.51 | 277166 | 0 | 0 | 13 | 0 |
| 23 | 239424 | 4.16 | 152.98GB | 4.22 | 246414 | 0 | 0 | 5 | 0 |
| Total | 5760717 | 100.00 | 3.54TB | 100.00 | 6129170 | 0 | 0 | 372 | 0 |
 |
| Outgoing Feed (+ Top1000 #) | Accepted | %Acc | %Tot | Art/sec | Volume | %Vol | KB/art | Dups | Rejs | % Ratio (Out/In) | ||
|---|---|---|---|---|---|---|---|---|---|---|---|---|
| 1 | 217.73.144.40 | 0 | 0.00 | 0.00 | 0.00 | 0.00KB | 0.00 | 0.00 | 5675048 | 0 | … | |
| Total | 0 | 0.00 | 0.00 | 0.00 | 0.00KB | 0.00 | 0.00 | 5675048 | 0 | |||
 |
| Outgoing Feed (+ Top1000 #) | Volume | %Vol | Kbps | Accepted | %Acc | %Tot | KB/art | Dups | Rejs | % Ratio (Out/In) | ||
|---|---|---|---|---|---|---|---|---|---|---|---|---|
| 1 | 217.73.144.40 | 0.00KB | 0.00 | 0.00 | 0 | 0.00 | 0.00 | 0.00 | 5675048 | 0 | … | |
| Total | 0.00KB | 0.00 | 0.00 | 0 | 0.00 | 0.00 | 0.00 | 5675048 | 0 | |||
 |
| Outgoing Feed (+ Top1000 #) | Rej. Vol. | %Vol | Kbps | Accepted | %Acc | %Tot | KB/art | Dups | Rejs | % Ratio (Out/In) | ||
|---|---|---|---|---|---|---|---|---|---|---|---|---|
| 1 | 217.73.144.40 | 0.00KB | 0.00 | 0.00 | 0 | 0.00 | 0.00 | 0.00 | 5675048 | 0 | … | |
| Total | 0.00KB | 0.00 | 0.00 | 0 | 0.00 | 0.00 | 0.00 | 5675048 | 0 | |||
 |
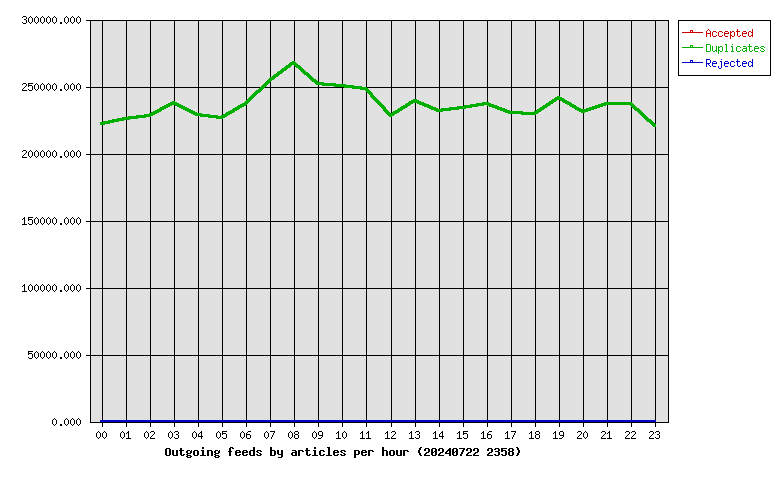
| Hour | Accepted | %Acc | Volume | %Vol | dups | Rejs |
|---|---|---|---|---|---|---|
| 00 | 0 | 0.00 | 0.00KB | 0.00 | 222071 | 0 |
| 01 | 0 | 0.00 | 0.00KB | 0.00 | 225759 | 0 |
| 02 | 0 | 0.00 | 0.00KB | 0.00 | 228049 | 0 |
| 03 | 0 | 0.00 | 0.00KB | 0.00 | 237730 | 0 |
| 04 | 0 | 0.00 | 0.00KB | 0.00 | 228820 | 0 |
| 05 | 0 | 0.00 | 0.00KB | 0.00 | 226800 | 0 |
| 06 | 0 | 0.00 | 0.00KB | 0.00 | 237304 | 0 |
| 07 | 0 | 0.00 | 0.00KB | 0.00 | 253887 | 0 |
| 08 | 0 | 0.00 | 0.00KB | 0.00 | 267755 | 0 |
| 09 | 0 | 0.00 | 0.00KB | 0.00 | 251969 | 0 |
| 10 | 0 | 0.00 | 0.00KB | 0.00 | 250314 | 0 |
| 11 | 0 | 0.00 | 0.00KB | 0.00 | 248287 | 0 |
| 12 | 0 | 0.00 | 0.00KB | 0.00 | 228310 | 0 |
| 13 | 0 | 0.00 | 0.00KB | 0.00 | 239539 | 0 |
| 14 | 0 | 0.00 | 0.00KB | 0.00 | 231613 | 0 |
| 15 | 0 | 0.00 | 0.00KB | 0.00 | 233766 | 0 |
| 16 | 0 | 0.00 | 0.00KB | 0.00 | 236881 | 0 |
| 17 | 0 | 0.00 | 0.00KB | 0.00 | 230154 | 0 |
| 18 | 0 | 0.00 | 0.00KB | 0.00 | 229574 | 0 |
| 19 | 0 | 0.00 | 0.00KB | 0.00 | 241107 | 0 |
| 20 | 0 | 0.00 | 0.00KB | 0.00 | 231070 | 0 |
| 21 | 0 | 0.00 | 0.00KB | 0.00 | 236854 | 0 |
| 22 | 0 | 0.00 | 0.00KB | 0.00 | 237074 | 0 |
| 23 | 0 | 0.00 | 0.00KB | 0.00 | 220361 | 0 |
| Total | 0 | 0.00 | 0.00KB | 0.00 | 5675048 | 0 |
 |
| >= 20% Full | >= 35% Full | >= 50% Full | >= 65% Full | >= 80% Full | >= 95% Full |
| Outgoing Feed | Batch Seq | Batch Num | Batch Max | %Full | Av. Pending |
|---|---|---|---|---|---|
| nbr.elbracht.net-o | 971359-971440 | 81 | 500 | 16 | 0.0 |
| text-spool-out | 0-0 | 0 | 500 | 0 | 0.0 |
| 1st Time | Last Time | # Msgs | Message |
|---|---|---|---|
| 17:07:04 | 1 | DNS Fwd/Rev mismatch: lookup of centos7134233.aspadmin.net failed |