| |
DIABLO statistics for newsfeed.yoursite.com on Sun 21 Jul 2024 |
Generated on 20240721 2358 by feeder-stats v4.006. Copyright © 2002 The Diablo Project.
Diablo running processes:  81    Dnewslink running processes:  0


11:59PM  up 154 days,  7:18, 0 users, load averages: 0.97, 0.74, 0.68

Filesystem     Size    Used   Avail Capacity  Mounted on
/dev/da0s1g     94G    1.2G     85G     1%    /news
/dev/da1       7.3T    6.6T     89G    99%    /news2/spool/news/00
/dev/da2       7.3T    6.6T     91G    99%    /news2/spool/news/01
/dev/da3       3.7T    3.2T    113G    97%    /news2/spool/news/02
/dev/da4       5.5T      5T     68G    99%    /news2/spool/news/03
/dev/da8       7.3T    6.6T     91G    99%    /news2/spool/news/04
/dev/da9       7.3T    6.6T     89G    99%    /news2/spool/news/05
/dev/da10      7.3T    6.6T     86G    99%    /news2/spool/news/06
/dev/da11      5.5T    4.9T    109G    98%    /news2/spool/news/07
/dev/da12      5.5T      5T     64G    99%    /news2/spool/news/08
/dev/da13      7.3T    6.6T     87G    99%    /news2/spool/news/09
/dev/da14      7.3T    6.6T     86G    99%    /news2/spool/news/10
/dev/da15      7.3T    6.6T     85G    99%    /news2/spool/news/11
/dev/da16      7.3T    6.6T     89G    99%    /news2/spool/news/12
/dev/da17      7.3T    6.6T     88G    99%    /news2/spool/news/13
/dev/da18      7.3T    6.6T     89G    99%    /news2/spool/news/14
/dev/da19      7.3T    6.6T     85G    99%    /news2/spool/news/15
/dev/da20      7.3T    6.6T     83G    99%    /news2/spool/news/16
/dev/da21      7.3T    6.6T     86G    99%    /news2/spool/news/17
/dev/da22      7.3T    6.6T     86G    99%    /news2/spool/news/18
/dev/da23      7.3T    6.6T     84G    99%    /news2/spool/news/19
/dev/da24      7.3T    6.6T     91G    99%    /news2/spool/news/20
/dev/da25      7.3T    6.6T     87G    99%    /news2/spool/news/21
/dev/da26      7.3T    6.6T     88G    99%    /news2/spool/news/22
/dev/da5       221G     35G    168G    17%    /news1
/dev/md0        40G     13G     22G    38%    /news3
| Incoming Feed (+ Top1000 #) | Accepted | %Acc | %Tot | Art/sec | Volume | %Vol | KB/art | Check | Ihave | Spam | TooOld | Rejs | Errs | ||
|---|---|---|---|---|---|---|---|---|---|---|---|---|---|---|---|
| 1 | feeder.ecngs.de | 5254945 | 94.92 | 95.39 | 60.82 | 3.46TB | 99.94 | 707.91 | 5536167 | 0 | 0 | 0 | 134 | 0 | |
| 2 | feeder2.ecngs.de | 253741 | 91.39 | 4.61 | 2.95 | 2.18GB | 0.06 | 9.01 | 277548 | 0 | 0 | 0 | 101 | 0 | |
| Total | 5508686 | 0.00 | 100.00 | 63.77 | 3.47TB | 100.00 | 675.72 | 5813715 | 0 | 0 | 0 | 235 | 0 | ||
 |
| Incoming Feed (+ Top1000 #) | Volume | %Vol | Kbps | Accepted | %Acc | %Tot | KB/art | Check | Ihave | Spam | TooOld | Rejs | Errs | ||
|---|---|---|---|---|---|---|---|---|---|---|---|---|---|---|---|
| 1 | feeder.ecngs.de | 3.46TB | 99.94 | 344448.19 | 5254945 | 94.92 | 95.39 | 707.91 | 5536167 | 0 | 0 | 0 | 134 | 0 | |
| 2 | feeder2.ecngs.de | 2.18GB | 0.06 | 212.61 | 253741 | 91.39 | 4.61 | 9.01 | 277548 | 0 | 0 | 0 | 101 | 0 | |
| Total | 3.47TB | 100.00 | 344660.80 | 5508686 | 0.00 | 100.00 | 675.72 | 5813715 | 0 | 0 | 0 | 235 | 0 | ||
 |
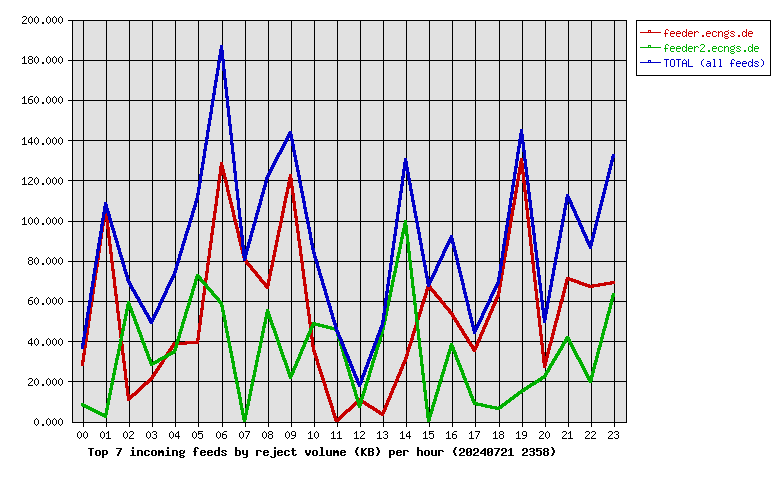
| Incoming Feed (+ Top1000 #) | Rej. Vol. | %Vol | Kbps | Accepted | %Acc | %Tot | KB/art | Check | Ihave | Spam | TooOld | Rejs | Errs | ||
|---|---|---|---|---|---|---|---|---|---|---|---|---|---|---|---|
| 1 | feeder.ecngs.de | 1.27MB | 62.04 | 0.12 | 5254945 | 94.92 | 95.39 | 707.91 | 5536167 | 0 | 0 | 0 | 134 | 0 | |
| 2 | feeder2.ecngs.de | 797.96KB | 37.96 | 0.07 | 253741 | 91.39 | 4.61 | 9.01 | 277548 | 0 | 0 | 0 | 101 | 0 | |
| Total | 2.05MB | 100.00 | 0.19 | 5508686 | 0.00 | 100.00 | 675.72 | 5813715 | 0 | 0 | 0 | 235 | 0 | ||
 |
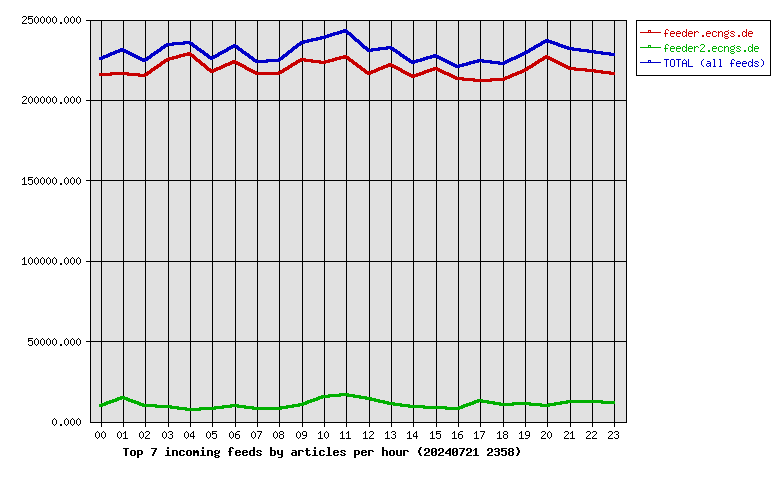
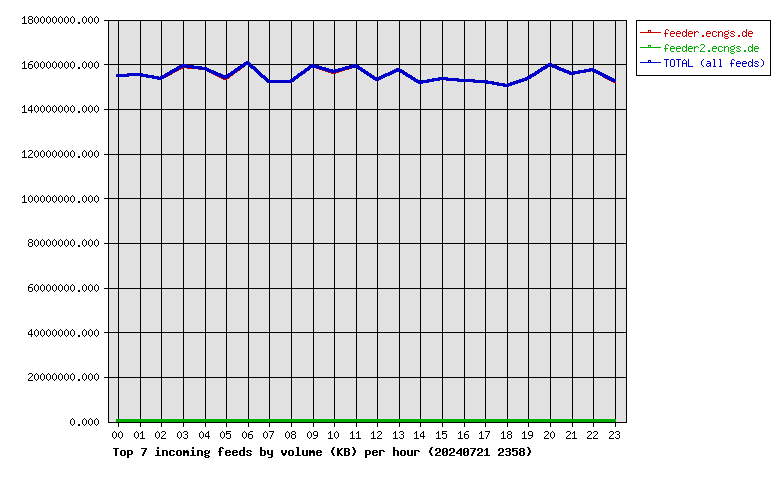
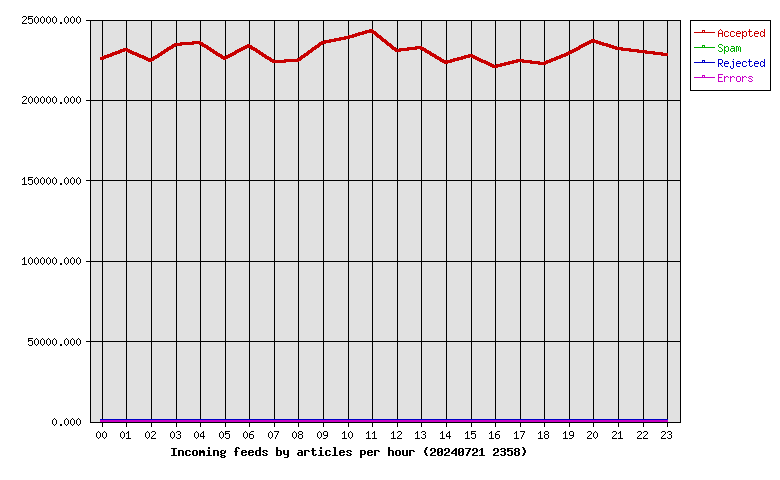
| Hour | Accepted | %Acc | Volume | %Vol | Check | Ihave | Spam | Rejs | Errs |
|---|---|---|---|---|---|---|---|---|---|
| 00 | 225616 | 4.10 | 147.74GB | 4.16 | 237032 | 0 | 0 | 5 | 0 |
| 01 | 230967 | 4.19 | 148.11GB | 4.17 | 248068 | 0 | 0 | 17 | 0 |
| 02 | 224299 | 4.07 | 146.31GB | 4.12 | 234909 | 0 | 0 | 11 | 0 |
| 03 | 233884 | 4.25 | 151.63GB | 4.27 | 244231 | 0 | 0 | 4 | 0 |
| 04 | 235255 | 4.27 | 150.68GB | 4.24 | 243151 | 0 | 0 | 7 | 0 |
| 05 | 225421 | 4.09 | 146.49GB | 4.13 | 245620 | 0 | 0 | 11 | 0 |
| 06 | 233537 | 4.24 | 153.15GB | 4.31 | 244727 | 0 | 0 | 13 | 0 |
| 07 | 223845 | 4.06 | 145.09GB | 4.09 | 233152 | 0 | 0 | 6 | 0 |
| 08 | 224258 | 4.07 | 144.97GB | 4.08 | 235166 | 0 | 0 | 11 | 0 |
| 09 | 235372 | 4.27 | 151.74GB | 4.27 | 248186 | 0 | 0 | 13 | 0 |
| 10 | 238428 | 4.33 | 149.08GB | 4.20 | 255722 | 0 | 0 | 10 | 0 |
| 11 | 242868 | 4.41 | 151.80GB | 4.28 | 261638 | 0 | 0 | 6 | 0 |
| 12 | 230500 | 4.18 | 145.75GB | 4.11 | 246639 | 0 | 0 | 6 | 0 |
| 13 | 232395 | 4.22 | 150.00GB | 4.23 | 244673 | 0 | 0 | 5 | 0 |
| 14 | 223184 | 4.05 | 144.75GB | 4.08 | 233825 | 0 | 0 | 12 | 0 |
| 15 | 227336 | 4.13 | 146.29GB | 4.12 | 235620 | 0 | 0 | 3 | 0 |
| 16 | 220352 | 4.00 | 145.58GB | 4.10 | 229771 | 0 | 0 | 15 | 0 |
| 17 | 224476 | 4.07 | 144.91GB | 4.08 | 238838 | 0 | 0 | 5 | 0 |
| 18 | 222365 | 4.04 | 143.15GB | 4.03 | 233654 | 0 | 0 | 7 | 0 |
| 19 | 228508 | 4.15 | 146.41GB | 4.12 | 240467 | 0 | 0 | 16 | 0 |
| 20 | 236582 | 4.29 | 152.16GB | 4.29 | 247900 | 0 | 0 | 9 | 0 |
| 21 | 231468 | 4.20 | 148.59GB | 4.19 | 245732 | 0 | 0 | 14 | 0 |
| 22 | 229768 | 4.17 | 150.26GB | 4.23 | 243153 | 0 | 0 | 15 | 0 |
| 23 | 228002 | 4.14 | 145.24GB | 4.09 | 241841 | 0 | 0 | 14 | 0 |
| Total | 5508686 | 100.00 | 3.47TB | 100.00 | 5813715 | 0 | 0 | 235 | 0 |
 |
| Outgoing Feed (+ Top1000 #) | Accepted | %Acc | %Tot | Art/sec | Volume | %Vol | KB/art | Dups | Rejs | % Ratio (Out/In) | ||
|---|---|---|---|---|---|---|---|---|---|---|---|---|
| 1 | 217.73.144.40 | 0 | 0.00 | 0.00 | 0.00 | 0.00KB | 0.00 | 0.00 | 5542761 | 0 | … | |
| Total | 0 | 0.00 | 0.00 | 0.00 | 0.00KB | 0.00 | 0.00 | 5542761 | 0 | |||
 |
| Outgoing Feed (+ Top1000 #) | Volume | %Vol | Kbps | Accepted | %Acc | %Tot | KB/art | Dups | Rejs | % Ratio (Out/In) | ||
|---|---|---|---|---|---|---|---|---|---|---|---|---|
| 1 | 217.73.144.40 | 0.00KB | 0.00 | 0.00 | 0 | 0.00 | 0.00 | 0.00 | 5542761 | 0 | … | |
| Total | 0.00KB | 0.00 | 0.00 | 0 | 0.00 | 0.00 | 0.00 | 5542761 | 0 | |||
 |
| Outgoing Feed (+ Top1000 #) | Rej. Vol. | %Vol | Kbps | Accepted | %Acc | %Tot | KB/art | Dups | Rejs | % Ratio (Out/In) | ||
|---|---|---|---|---|---|---|---|---|---|---|---|---|
| 1 | 217.73.144.40 | 0.00KB | 0.00 | 0.00 | 0 | 0.00 | 0.00 | 0.00 | 5542761 | 0 | … | |
| Total | 0.00KB | 0.00 | 0.00 | 0 | 0.00 | 0.00 | 0.00 | 5542761 | 0 | |||
 |
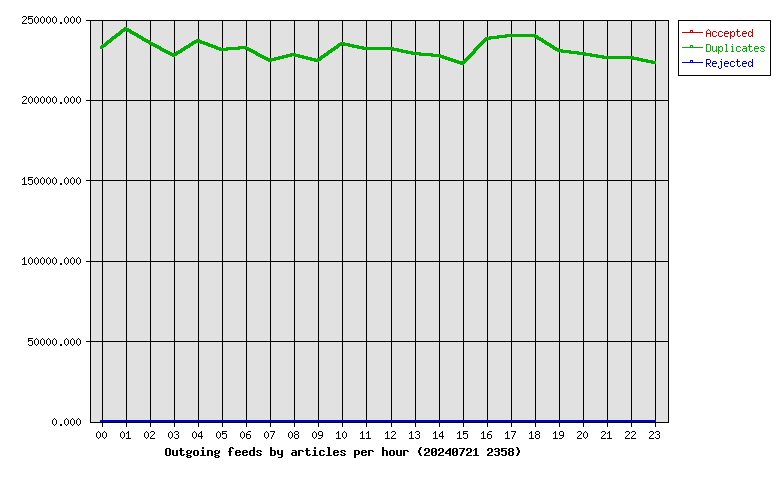
| Hour | Accepted | %Acc | Volume | %Vol | dups | Rejs |
|---|---|---|---|---|---|---|
| 00 | 0 | 0.00 | 0.00KB | 0.00 | 232250 | 0 |
| 01 | 0 | 0.00 | 0.00KB | 0.00 | 244062 | 0 |
| 02 | 0 | 0.00 | 0.00KB | 0.00 | 235249 | 0 |
| 03 | 0 | 0.00 | 0.00KB | 0.00 | 227312 | 0 |
| 04 | 0 | 0.00 | 0.00KB | 0.00 | 236838 | 0 |
| 05 | 0 | 0.00 | 0.00KB | 0.00 | 230857 | 0 |
| 06 | 0 | 0.00 | 0.00KB | 0.00 | 232357 | 0 |
| 07 | 0 | 0.00 | 0.00KB | 0.00 | 224204 | 0 |
| 08 | 0 | 0.00 | 0.00KB | 0.00 | 227947 | 0 |
| 09 | 0 | 0.00 | 0.00KB | 0.00 | 224089 | 0 |
| 10 | 0 | 0.00 | 0.00KB | 0.00 | 234612 | 0 |
| 11 | 0 | 0.00 | 0.00KB | 0.00 | 231474 | 0 |
| 12 | 0 | 0.00 | 0.00KB | 0.00 | 231424 | 0 |
| 13 | 0 | 0.00 | 0.00KB | 0.00 | 228573 | 0 |
| 14 | 0 | 0.00 | 0.00KB | 0.00 | 227611 | 0 |
| 15 | 0 | 0.00 | 0.00KB | 0.00 | 222455 | 0 |
| 16 | 0 | 0.00 | 0.00KB | 0.00 | 237764 | 0 |
| 17 | 0 | 0.00 | 0.00KB | 0.00 | 239638 | 0 |
| 18 | 0 | 0.00 | 0.00KB | 0.00 | 239480 | 0 |
| 19 | 0 | 0.00 | 0.00KB | 0.00 | 230666 | 0 |
| 20 | 0 | 0.00 | 0.00KB | 0.00 | 228814 | 0 |
| 21 | 0 | 0.00 | 0.00KB | 0.00 | 226149 | 0 |
| 22 | 0 | 0.00 | 0.00KB | 0.00 | 226218 | 0 |
| 23 | 0 | 0.00 | 0.00KB | 0.00 | 222718 | 0 |
| Total | 0 | 0.00 | 0.00KB | 0.00 | 5542761 | 0 |
 |
| >= 20% Full | >= 35% Full | >= 50% Full | >= 65% Full | >= 80% Full | >= 95% Full |
| Outgoing Feed | Batch Seq | Batch Num | Batch Max | %Full | Av. Pending |
|---|---|---|---|---|---|
| nbr.elbracht.net-o | 971071-971152 | 81 | 500 | 16 | 0.0 |
| text-spool-out | 0-0 | 0 | 500 | 0 | 0.0 |
| 1st Time | Last Time | # Msgs | Message |
|---|