| |
DIABLO statistics for newsfeed.yoursite.com on Sat 20 Jul 2024 |
Generated on 20240720 2358 by feeder-stats v4.006. Copyright © 2002 The Diablo Project.
Diablo running processes:  81    Dnewslink running processes:  0


11:59PM  up 153 days,  7:18, 0 users, load averages: 1.93, 1.15, 0.92

Filesystem     Size    Used   Avail Capacity  Mounted on
/dev/da0s1g     94G    1.2G     85G     1%    /news
/dev/da1       7.3T    6.6T     83G    99%    /news2/spool/news/00
/dev/da2       7.3T    6.6T     84G    99%    /news2/spool/news/01
/dev/da3       3.7T    3.3T     95G    97%    /news2/spool/news/02
/dev/da4       5.5T      5T     88G    98%    /news2/spool/news/03
/dev/da8       7.3T    6.6T     84G    99%    /news2/spool/news/04
/dev/da9       7.3T    6.6T     83G    99%    /news2/spool/news/05
/dev/da10      7.3T    6.6T     80G    99%    /news2/spool/news/06
/dev/da11      5.5T    4.9T     98G    98%    /news2/spool/news/07
/dev/da12      5.5T    4.9T    102G    98%    /news2/spool/news/08
/dev/da13      7.3T    6.6T     81G    99%    /news2/spool/news/09
/dev/da14      7.3T    6.6T     80G    99%    /news2/spool/news/10
/dev/da15      7.3T    6.6T     78G    99%    /news2/spool/news/11
/dev/da16      7.3T    6.6T     83G    99%    /news2/spool/news/12
/dev/da17      7.3T    6.6T     81G    99%    /news2/spool/news/13
/dev/da18      7.3T    6.6T     83G    99%    /news2/spool/news/14
/dev/da19      7.3T    6.6T     78G    99%    /news2/spool/news/15
/dev/da20      7.3T    6.6T     77G    99%    /news2/spool/news/16
/dev/da21      7.3T    6.6T     80G    99%    /news2/spool/news/17
/dev/da22      7.3T    6.6T     79G    99%    /news2/spool/news/18
/dev/da23      7.3T    6.6T     78G    99%    /news2/spool/news/19
/dev/da24      7.3T    6.6T     85G    99%    /news2/spool/news/20
/dev/da25      7.3T    6.6T     80G    99%    /news2/spool/news/21
/dev/da26      7.3T    6.6T     82G    99%    /news2/spool/news/22
/dev/da5       221G     35G    168G    17%    /news1
/dev/md0        40G     13G     22G    38%    /news3
| Incoming Feed (+ Top1000 #) | Accepted | %Acc | %Tot | Art/sec | Volume | %Vol | KB/art | Check | Ihave | Spam | TooOld | Rejs | Errs | ||
|---|---|---|---|---|---|---|---|---|---|---|---|---|---|---|---|
| 1 | feeder.ecngs.de | 5676969 | 95.01 | 95.53 | 65.71 | 3.65TB | 99.92 | 690.60 | 5974977 | 0 | 0 | 0 | 156 | 0 | |
| 2 | feeder2.ecngs.de | 265431 | 90.38 | 4.47 | 3.09 | 2.88GB | 0.08 | 11.39 | 293540 | 0 | 0 | 0 | 150 | 0 | |
| Total | 5942400 | 0.00 | 100.00 | 68.79 | 3.65TB | 100.00 | 660.26 | 6268517 | 0 | 0 | 0 | 306 | 0 | ||
 |
| Incoming Feed (+ Top1000 #) | Volume | %Vol | Kbps | Accepted | %Acc | %Tot | KB/art | Check | Ihave | Spam | TooOld | Rejs | Errs | ||
|---|---|---|---|---|---|---|---|---|---|---|---|---|---|---|---|
| 1 | feeder.ecngs.de | 3.65TB | 99.92 | 363008.36 | 5676969 | 95.01 | 95.53 | 690.60 | 5974977 | 0 | 0 | 0 | 156 | 0 | |
| 2 | feeder2.ecngs.de | 2.88GB | 0.08 | 281.19 | 265431 | 90.38 | 4.47 | 11.39 | 293540 | 0 | 0 | 0 | 150 | 0 | |
| Total | 3.65TB | 100.00 | 363289.55 | 5942400 | 0.00 | 100.00 | 660.26 | 6268517 | 0 | 0 | 0 | 306 | 0 | ||
 |
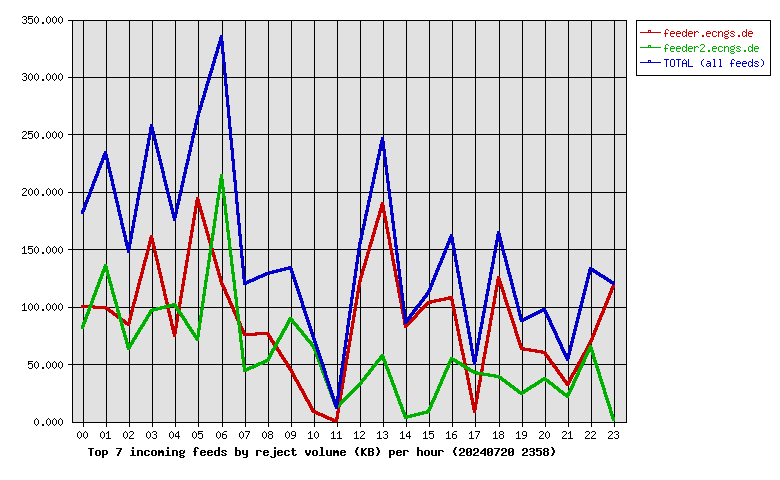
| Incoming Feed (+ Top1000 #) | Rej. Vol. | %Vol | Kbps | Accepted | %Acc | %Tot | KB/art | Check | Ihave | Spam | TooOld | Rejs | Errs | ||
|---|---|---|---|---|---|---|---|---|---|---|---|---|---|---|---|
| 1 | feeder.ecngs.de | 2.07MB | 60.03 | 0.20 | 5676969 | 95.01 | 95.53 | 690.60 | 5974977 | 0 | 0 | 0 | 156 | 0 | |
| 2 | feeder2.ecngs.de | 1.38MB | 39.97 | 0.13 | 265431 | 90.38 | 4.47 | 11.39 | 293540 | 0 | 0 | 0 | 150 | 0 | |
| Total | 3.44MB | 100.00 | 0.33 | 5942400 | 0.00 | 100.00 | 660.26 | 6268517 | 0 | 0 | 0 | 306 | 0 | ||
 |
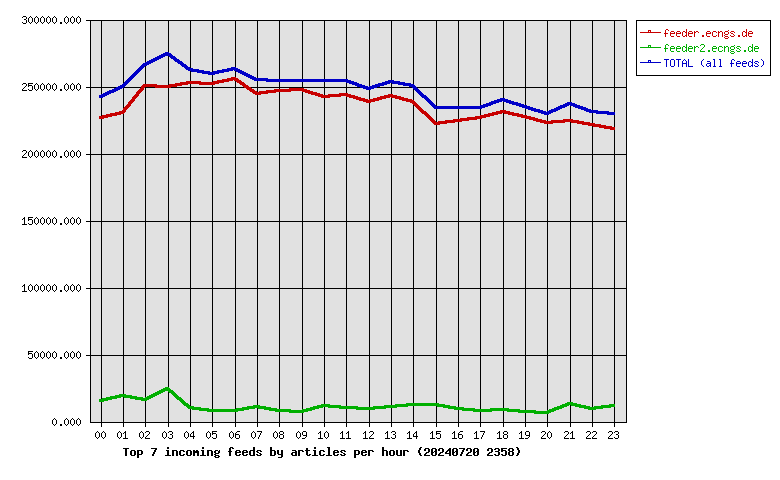
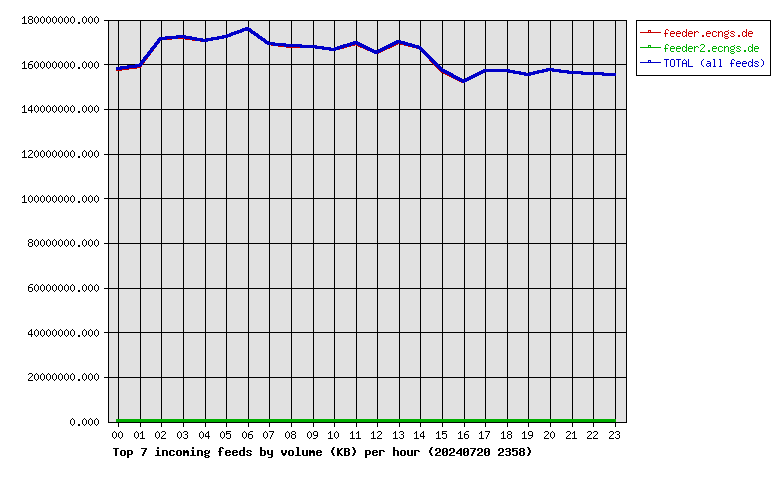
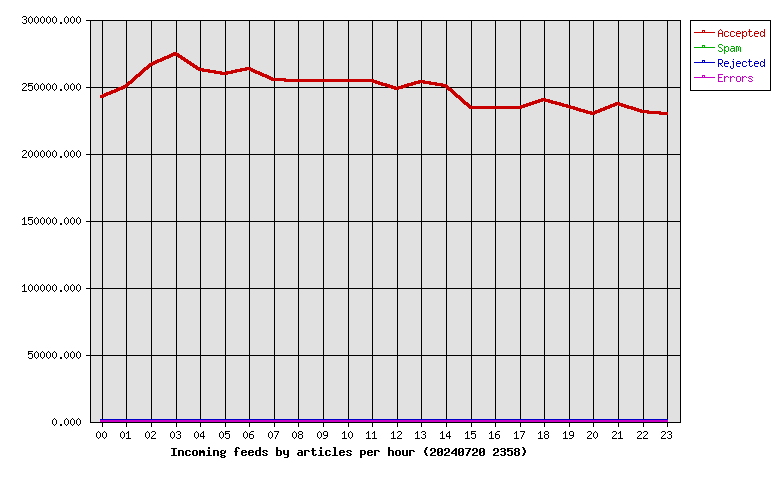
| Hour | Accepted | %Acc | Volume | %Vol | Check | Ihave | Spam | Rejs | Errs |
|---|---|---|---|---|---|---|---|---|---|
| 00 | 241901 | 4.07 | 150.32GB | 4.02 | 260753 | 0 | 0 | 14 | 0 |
| 01 | 249472 | 4.20 | 151.64GB | 4.05 | 271692 | 0 | 0 | 28 | 0 |
| 02 | 265902 | 4.47 | 163.37GB | 4.37 | 284562 | 0 | 0 | 14 | 0 |
| 03 | 274030 | 4.61 | 164.13GB | 4.39 | 302989 | 0 | 0 | 18 | 0 |
| 04 | 262553 | 4.42 | 162.49GB | 4.34 | 273804 | 0 | 0 | 21 | 0 |
| 05 | 259478 | 4.37 | 164.36GB | 4.39 | 284896 | 0 | 0 | 15 | 0 |
| 06 | 263114 | 4.43 | 167.63GB | 4.48 | 272370 | 0 | 0 | 21 | 0 |
| 07 | 254947 | 4.29 | 161.28GB | 4.31 | 267452 | 0 | 0 | 15 | 0 |
| 08 | 253764 | 4.27 | 160.17GB | 4.28 | 264439 | 0 | 0 | 13 | 0 |
| 09 | 254322 | 4.28 | 159.88GB | 4.27 | 262364 | 0 | 0 | 8 | 0 |
| 10 | 253815 | 4.27 | 158.76GB | 4.24 | 267154 | 0 | 0 | 7 | 0 |
| 11 | 253815 | 4.27 | 161.44GB | 4.31 | 265085 | 0 | 0 | 2 | 0 |
| 12 | 247768 | 4.17 | 157.41GB | 4.21 | 258874 | 0 | 0 | 14 | 0 |
| 13 | 253611 | 4.27 | 161.91GB | 4.33 | 266123 | 0 | 0 | 21 | 0 |
| 14 | 250614 | 4.22 | 159.61GB | 4.27 | 264048 | 0 | 0 | 5 | 0 |
| 15 | 234026 | 3.94 | 149.93GB | 4.01 | 246740 | 0 | 0 | 11 | 0 |
| 16 | 234038 | 3.94 | 144.95GB | 3.87 | 245832 | 0 | 0 | 13 | 0 |
| 17 | 234024 | 3.94 | 149.59GB | 4.00 | 242534 | 0 | 0 | 8 | 0 |
| 18 | 239643 | 4.03 | 149.58GB | 4.00 | 249889 | 0 | 0 | 9 | 0 |
| 19 | 234484 | 3.95 | 147.88GB | 3.95 | 242526 | 0 | 0 | 14 | 0 |
| 20 | 229582 | 3.86 | 150.05GB | 4.01 | 237138 | 0 | 0 | 9 | 0 |
| 21 | 236842 | 3.99 | 148.90GB | 3.98 | 251559 | 0 | 0 | 10 | 0 |
| 22 | 231032 | 3.89 | 148.54GB | 3.97 | 242462 | 0 | 0 | 9 | 0 |
| 23 | 229623 | 3.86 | 147.94GB | 3.95 | 243232 | 0 | 0 | 7 | 0 |
| Total | 5942400 | 100.00 | 3.65TB | 100.00 | 6268517 | 0 | 0 | 306 | 0 |
 |
| Outgoing Feed (+ Top1000 #) | Accepted | %Acc | %Tot | Art/sec | Volume | %Vol | KB/art | Dups | Rejs | % Ratio (Out/In) | ||
|---|---|---|---|---|---|---|---|---|---|---|---|---|
| 1 | 217.73.144.40 | 0 | 0.00 | 0.00 | 0.00 | 0.00KB | 0.00 | 0.00 | 6394603 | 0 | … | |
| Total | 0 | 0.00 | 0.00 | 0.00 | 0.00KB | 0.00 | 0.00 | 6394603 | 0 | |||
 |
| Outgoing Feed (+ Top1000 #) | Volume | %Vol | Kbps | Accepted | %Acc | %Tot | KB/art | Dups | Rejs | % Ratio (Out/In) | ||
|---|---|---|---|---|---|---|---|---|---|---|---|---|
| 1 | 217.73.144.40 | 0.00KB | 0.00 | 0.00 | 0 | 0.00 | 0.00 | 0.00 | 6394603 | 0 | … | |
| Total | 0.00KB | 0.00 | 0.00 | 0 | 0.00 | 0.00 | 0.00 | 6394603 | 0 | |||
 |
| Outgoing Feed (+ Top1000 #) | Rej. Vol. | %Vol | Kbps | Accepted | %Acc | %Tot | KB/art | Dups | Rejs | % Ratio (Out/In) | ||
|---|---|---|---|---|---|---|---|---|---|---|---|---|
| 1 | 217.73.144.40 | 0.00KB | 0.00 | 0.00 | 0 | 0.00 | 0.00 | 0.00 | 6394603 | 0 | … | |
| Total | 0.00KB | 0.00 | 0.00 | 0 | 0.00 | 0.00 | 0.00 | 6394603 | 0 | |||
 |
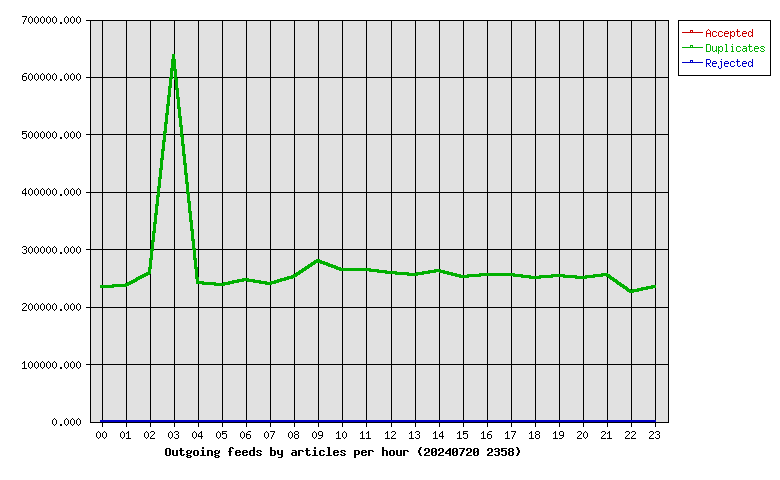
| Hour | Accepted | %Acc | Volume | %Vol | dups | Rejs |
|---|---|---|---|---|---|---|
| 00 | 0 | 0.00 | 0.00KB | 0.00 | 234554 | 0 |
| 01 | 0 | 0.00 | 0.00KB | 0.00 | 235342 | 0 |
| 02 | 0 | 0.00 | 0.00KB | 0.00 | 258557 | 0 |
| 03 | 0 | 0.00 | 0.00KB | 0.00 | 636071 | 0 |
| 04 | 0 | 0.00 | 0.00KB | 0.00 | 240583 | 0 |
| 05 | 0 | 0.00 | 0.00KB | 0.00 | 237995 | 0 |
| 06 | 0 | 0.00 | 0.00KB | 0.00 | 246460 | 0 |
| 07 | 0 | 0.00 | 0.00KB | 0.00 | 240105 | 0 |
| 08 | 0 | 0.00 | 0.00KB | 0.00 | 252200 | 0 |
| 09 | 0 | 0.00 | 0.00KB | 0.00 | 279758 | 0 |
| 10 | 0 | 0.00 | 0.00KB | 0.00 | 264625 | 0 |
| 11 | 0 | 0.00 | 0.00KB | 0.00 | 264600 | 0 |
| 12 | 0 | 0.00 | 0.00KB | 0.00 | 259177 | 0 |
| 13 | 0 | 0.00 | 0.00KB | 0.00 | 255016 | 0 |
| 14 | 0 | 0.00 | 0.00KB | 0.00 | 262157 | 0 |
| 15 | 0 | 0.00 | 0.00KB | 0.00 | 251336 | 0 |
| 16 | 0 | 0.00 | 0.00KB | 0.00 | 255080 | 0 |
| 17 | 0 | 0.00 | 0.00KB | 0.00 | 254507 | 0 |
| 18 | 0 | 0.00 | 0.00KB | 0.00 | 249810 | 0 |
| 19 | 0 | 0.00 | 0.00KB | 0.00 | 252977 | 0 |
| 20 | 0 | 0.00 | 0.00KB | 0.00 | 249268 | 0 |
| 21 | 0 | 0.00 | 0.00KB | 0.00 | 255290 | 0 |
| 22 | 0 | 0.00 | 0.00KB | 0.00 | 225552 | 0 |
| 23 | 0 | 0.00 | 0.00KB | 0.00 | 233583 | 0 |
| Total | 0 | 0.00 | 0.00KB | 0.00 | 6394603 | 0 |
 |
| >= 20% Full | >= 35% Full | >= 50% Full | >= 65% Full | >= 80% Full | >= 95% Full |
| Outgoing Feed | Batch Seq | Batch Num | Batch Max | %Full | Av. Pending |
|---|---|---|---|---|---|
| nbr.elbracht.net-o | 970783-970864 | 81 | 500 | 16 | 0.0 |
| text-spool-out | 0-0 | 0 | 500 | 0 | 0.0 |
| 1st Time | Last Time | # Msgs | Message |
|---|---|---|---|
| 17:09:08 | 1 | DNS Fwd/Rev mismatch: visit.keznews.com/194.165.16.10 |