| |
DIABLO statistics for newsfeed.yoursite.com on Fri 19 Jul 2024 |
Generated on 20240719 2358 by feeder-stats v4.006. Copyright © 2002 The Diablo Project.
Diablo running processes:  81    Dnewslink running processes:  0


11:59PM  up 152 days,  7:18, 0 users, load averages: 1.09, 0.77, 0.65

Filesystem     Size    Used   Avail Capacity  Mounted on
/dev/da0s1g     94G    1.2G     85G     1%    /news
/dev/da1       7.3T    6.6T     83G    99%    /news2/spool/news/00
/dev/da2       7.3T    6.6T     84G    99%    /news2/spool/news/01
/dev/da3       3.7T    3.3T     95G    97%    /news2/spool/news/02
/dev/da4       5.5T      5T     83G    98%    /news2/spool/news/03
/dev/da8       7.3T    6.6T     83G    99%    /news2/spool/news/04
/dev/da9       7.3T    6.6T     83G    99%    /news2/spool/news/05
/dev/da10      7.3T    6.6T     79G    99%    /news2/spool/news/06
/dev/da11      5.5T      5T     86G    98%    /news2/spool/news/07
/dev/da12      5.5T    4.9T    101G    98%    /news2/spool/news/08
/dev/da13      7.3T    6.6T     80G    99%    /news2/spool/news/09
/dev/da14      7.3T    6.6T     79G    99%    /news2/spool/news/10
/dev/da15      7.3T    6.6T     79G    99%    /news2/spool/news/11
/dev/da16      7.3T    6.6T     82G    99%    /news2/spool/news/12
/dev/da17      7.3T    6.6T     80G    99%    /news2/spool/news/13
/dev/da18      7.3T    6.6T     82G    99%    /news2/spool/news/14
/dev/da19      7.3T    6.6T     78G    99%    /news2/spool/news/15
/dev/da20      7.3T    6.6T     77G    99%    /news2/spool/news/16
/dev/da21      7.3T    6.6T     80G    99%    /news2/spool/news/17
/dev/da22      7.3T    6.6T     78G    99%    /news2/spool/news/18
/dev/da23      7.3T    6.6T     77G    99%    /news2/spool/news/19
/dev/da24      7.3T    6.6T     83G    99%    /news2/spool/news/20
/dev/da25      7.3T    6.6T     80G    99%    /news2/spool/news/21
/dev/da26      7.3T    6.6T     81G    99%    /news2/spool/news/22
/dev/da5       221G     35G    168G    17%    /news1
/dev/md0        40G     13G     22G    38%    /news3
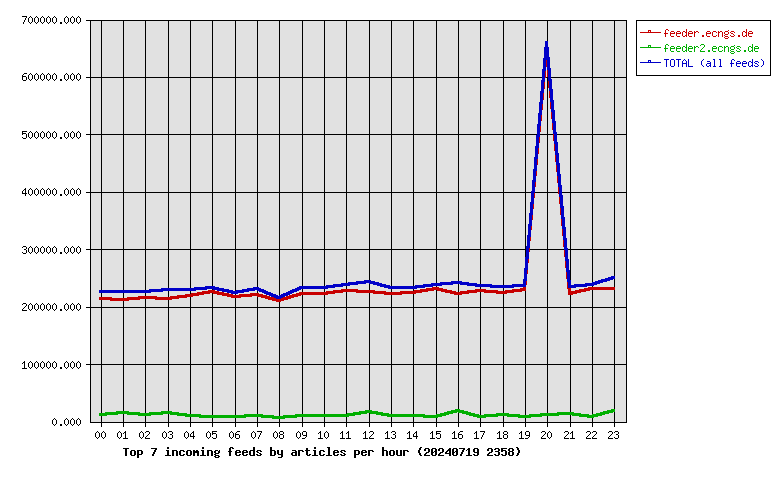
| Incoming Feed (+ Top1000 #) | Accepted | %Acc | %Tot | Art/sec | Volume | %Vol | KB/art | Check | Ihave | Spam | TooOld | Rejs | Errs | ||
|---|---|---|---|---|---|---|---|---|---|---|---|---|---|---|---|
| 1 | feeder.ecngs.de | 5753844 | 95.31 | 95.70 | 66.60 | 3.48TB | 99.93 | 649.20 | 6037059 | 0 | 0 | 0 | 157 | 0 | |
| 2 | feeder2.ecngs.de | 258702 | 91.03 | 4.30 | 3.01 | 2.32GB | 0.07 | 9.40 | 284072 | 0 | 0 | 0 | 128 | 0 | |
| Total | 6012546 | 0.00 | 100.00 | 69.61 | 3.48TB | 100.00 | 621.67 | 6321131 | 0 | 0 | 0 | 285 | 0 | ||
 |
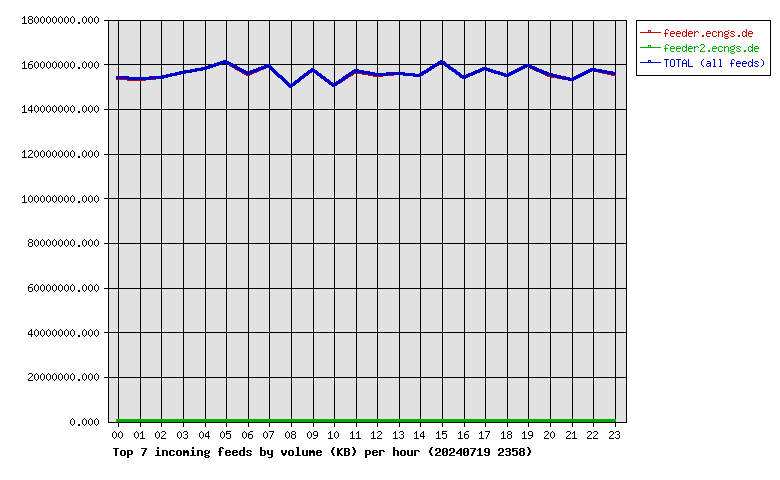
| Incoming Feed (+ Top1000 #) | Volume | %Vol | Kbps | Accepted | %Acc | %Tot | KB/art | Check | Ihave | Spam | TooOld | Rejs | Errs | ||
|---|---|---|---|---|---|---|---|---|---|---|---|---|---|---|---|
| 1 | feeder.ecngs.de | 3.48TB | 99.93 | 345870.94 | 5753844 | 95.31 | 95.70 | 649.20 | 6037059 | 0 | 0 | 0 | 157 | 0 | |
| 2 | feeder2.ecngs.de | 2.32GB | 0.07 | 226.53 | 258702 | 91.03 | 4.30 | 9.40 | 284072 | 0 | 0 | 0 | 128 | 0 | |
| Total | 3.48TB | 100.00 | 346097.47 | 6012546 | 0.00 | 100.00 | 621.67 | 6321131 | 0 | 0 | 0 | 285 | 0 | ||
 |
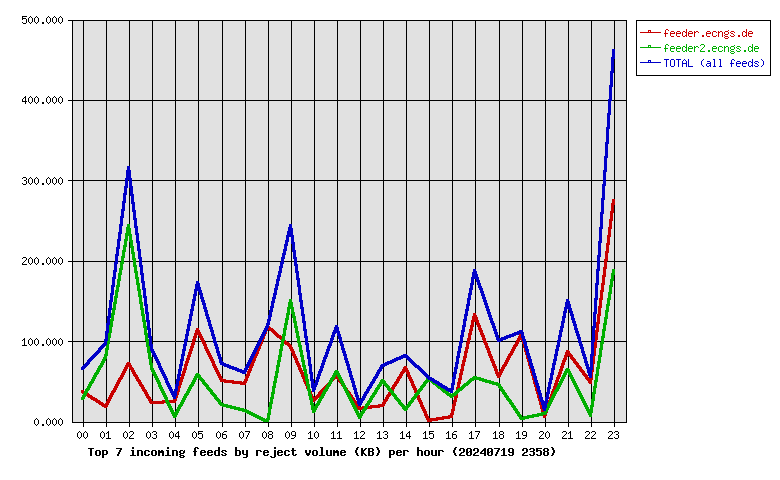
| Incoming Feed (+ Top1000 #) | Rej. Vol. | %Vol | Kbps | Accepted | %Acc | %Tot | KB/art | Check | Ihave | Spam | TooOld | Rejs | Errs | ||
|---|---|---|---|---|---|---|---|---|---|---|---|---|---|---|---|
| 1 | feeder.ecngs.de | 1.46MB | 54.23 | 0.14 | 5753844 | 95.31 | 95.70 | 649.20 | 6037059 | 0 | 0 | 0 | 157 | 0 | |
| 2 | feeder2.ecngs.de | 1.23MB | 45.77 | 0.12 | 258702 | 91.03 | 4.30 | 9.40 | 284072 | 0 | 0 | 0 | 128 | 0 | |
| Total | 2.69MB | 100.00 | 0.26 | 6012546 | 0.00 | 100.00 | 621.67 | 6321131 | 0 | 0 | 0 | 285 | 0 | ||
 |
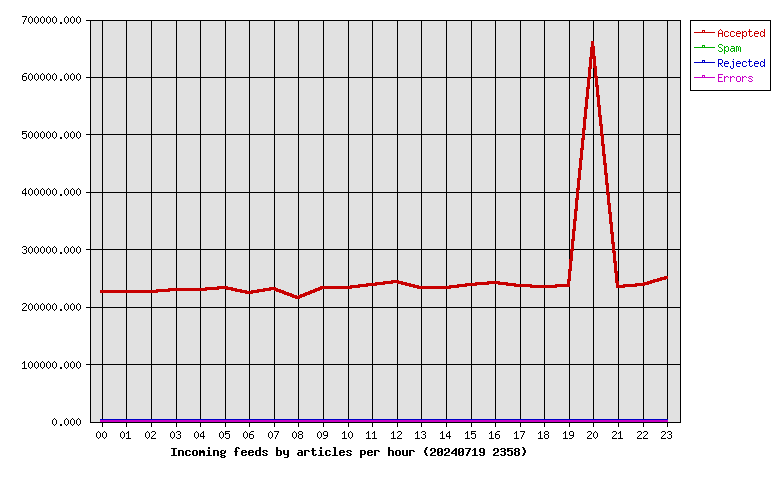
| Hour | Accepted | %Acc | Volume | %Vol | Check | Ihave | Spam | Rejs | Errs |
|---|---|---|---|---|---|---|---|---|---|
| 00 | 224960 | 3.74 | 146.47GB | 4.11 | 237399 | 0 | 0 | 10 | 0 |
| 01 | 226343 | 3.76 | 146.16GB | 4.10 | 243538 | 0 | 0 | 8 | 0 |
| 02 | 225627 | 3.75 | 146.68GB | 4.11 | 240092 | 0 | 0 | 32 | 0 |
| 03 | 228660 | 3.80 | 148.81GB | 4.17 | 243841 | 0 | 0 | 7 | 0 |
| 04 | 228501 | 3.80 | 150.62GB | 4.23 | 240996 | 0 | 0 | 4 | 0 |
| 05 | 233008 | 3.88 | 153.53GB | 4.31 | 254005 | 0 | 0 | 10 | 0 |
| 06 | 223320 | 3.71 | 148.24GB | 4.16 | 231894 | 0 | 0 | 6 | 0 |
| 07 | 230216 | 3.83 | 152.01GB | 4.26 | 240941 | 0 | 0 | 8 | 0 |
| 08 | 215601 | 3.59 | 142.91GB | 4.01 | 222670 | 0 | 0 | 10 | 0 |
| 09 | 232007 | 3.86 | 150.27GB | 4.22 | 241718 | 0 | 0 | 21 | 0 |
| 10 | 232623 | 3.87 | 143.30GB | 4.02 | 244933 | 0 | 0 | 6 | 0 |
| 11 | 237468 | 3.95 | 149.51GB | 4.19 | 248802 | 0 | 0 | 16 | 0 |
| 12 | 242108 | 4.03 | 147.82GB | 4.15 | 260866 | 0 | 0 | 9 | 0 |
| 13 | 232803 | 3.87 | 148.59GB | 4.17 | 243740 | 0 | 0 | 8 | 0 |
| 14 | 232931 | 3.87 | 147.67GB | 4.14 | 242994 | 0 | 0 | 7 | 0 |
| 15 | 237330 | 3.95 | 153.68GB | 4.31 | 245239 | 0 | 0 | 12 | 0 |
| 16 | 240345 | 4.00 | 146.70GB | 4.12 | 261092 | 0 | 0 | 11 | 0 |
| 17 | 236190 | 3.93 | 150.60GB | 4.22 | 245939 | 0 | 0 | 12 | 0 |
| 18 | 234957 | 3.91 | 147.72GB | 4.14 | 247307 | 0 | 0 | 13 | 0 |
| 19 | 236801 | 3.94 | 151.66GB | 4.25 | 245192 | 0 | 0 | 9 | 0 |
| 20 | 658776 | 10.96 | 147.76GB | 4.15 | 670951 | 0 | 0 | 3 | 0 |
| 21 | 234121 | 3.89 | 145.81GB | 4.09 | 248318 | 0 | 0 | 23 | 0 |
| 22 | 237984 | 3.96 | 149.95GB | 4.21 | 246491 | 0 | 0 | 8 | 0 |
| 23 | 249866 | 4.16 | 148.22GB | 4.16 | 272173 | 0 | 0 | 32 | 0 |
| Total | 6012546 | 100.00 | 3.48TB | 100.00 | 6321131 | 0 | 0 | 285 | 0 |
 |
| Outgoing Feed (+ Top1000 #) | Accepted | %Acc | %Tot | Art/sec | Volume | %Vol | KB/art | Dups | Rejs | % Ratio (Out/In) | ||
|---|---|---|---|---|---|---|---|---|---|---|---|---|
| 1 | 217.73.144.40 | 0 | 0.00 | 0.00 | 0.00 | 0.00KB | 0.00 | 0.00 | 5584343 | 0 | … | |
| Total | 0 | 0.00 | 0.00 | 0.00 | 0.00KB | 0.00 | 0.00 | 5584343 | 0 | |||
 |
| Outgoing Feed (+ Top1000 #) | Volume | %Vol | Kbps | Accepted | %Acc | %Tot | KB/art | Dups | Rejs | % Ratio (Out/In) | ||
|---|---|---|---|---|---|---|---|---|---|---|---|---|
| 1 | 217.73.144.40 | 0.00KB | 0.00 | 0.00 | 0 | 0.00 | 0.00 | 0.00 | 5584343 | 0 | … | |
| Total | 0.00KB | 0.00 | 0.00 | 0 | 0.00 | 0.00 | 0.00 | 5584343 | 0 | |||
 |
| Outgoing Feed (+ Top1000 #) | Rej. Vol. | %Vol | Kbps | Accepted | %Acc | %Tot | KB/art | Dups | Rejs | % Ratio (Out/In) | ||
|---|---|---|---|---|---|---|---|---|---|---|---|---|
| 1 | 217.73.144.40 | 0.00KB | 0.00 | 0.00 | 0 | 0.00 | 0.00 | 0.00 | 5584343 | 0 | … | |
| Total | 0.00KB | 0.00 | 0.00 | 0 | 0.00 | 0.00 | 0.00 | 5584343 | 0 | |||
 |
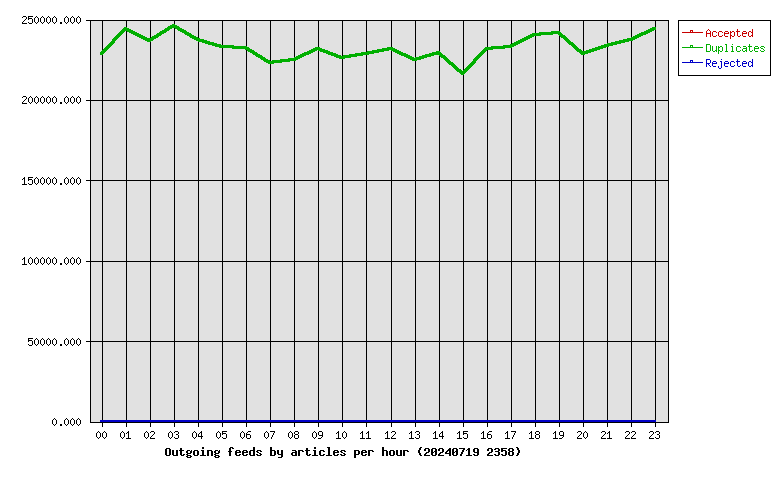
| Hour | Accepted | %Acc | Volume | %Vol | dups | Rejs |
|---|---|---|---|---|---|---|
| 00 | 0 | 0.00 | 0.00KB | 0.00 | 228278 | 0 |
| 01 | 0 | 0.00 | 0.00KB | 0.00 | 243924 | 0 |
| 02 | 0 | 0.00 | 0.00KB | 0.00 | 236928 | 0 |
| 03 | 0 | 0.00 | 0.00KB | 0.00 | 246236 | 0 |
| 04 | 0 | 0.00 | 0.00KB | 0.00 | 237389 | 0 |
| 05 | 0 | 0.00 | 0.00KB | 0.00 | 233046 | 0 |
| 06 | 0 | 0.00 | 0.00KB | 0.00 | 232285 | 0 |
| 07 | 0 | 0.00 | 0.00KB | 0.00 | 223238 | 0 |
| 08 | 0 | 0.00 | 0.00KB | 0.00 | 224702 | 0 |
| 09 | 0 | 0.00 | 0.00KB | 0.00 | 231484 | 0 |
| 10 | 0 | 0.00 | 0.00KB | 0.00 | 226038 | 0 |
| 11 | 0 | 0.00 | 0.00KB | 0.00 | 228385 | 0 |
| 12 | 0 | 0.00 | 0.00KB | 0.00 | 231801 | 0 |
| 13 | 0 | 0.00 | 0.00KB | 0.00 | 224861 | 0 |
| 14 | 0 | 0.00 | 0.00KB | 0.00 | 229278 | 0 |
| 15 | 0 | 0.00 | 0.00KB | 0.00 | 216350 | 0 |
| 16 | 0 | 0.00 | 0.00KB | 0.00 | 231557 | 0 |
| 17 | 0 | 0.00 | 0.00KB | 0.00 | 232602 | 0 |
| 18 | 0 | 0.00 | 0.00KB | 0.00 | 240404 | 0 |
| 19 | 0 | 0.00 | 0.00KB | 0.00 | 241553 | 0 |
| 20 | 0 | 0.00 | 0.00KB | 0.00 | 228851 | 0 |
| 21 | 0 | 0.00 | 0.00KB | 0.00 | 233752 | 0 |
| 22 | 0 | 0.00 | 0.00KB | 0.00 | 237254 | 0 |
| 23 | 0 | 0.00 | 0.00KB | 0.00 | 244147 | 0 |
| Total | 0 | 0.00 | 0.00KB | 0.00 | 5584343 | 0 |
 |
| >= 20% Full | >= 35% Full | >= 50% Full | >= 65% Full | >= 80% Full | >= 95% Full |
| Outgoing Feed | Batch Seq | Batch Num | Batch Max | %Full | Av. Pending |
|---|---|---|---|---|---|
| nbr.elbracht.net-o | 970495-970576 | 81 | 500 | 16 | 0.0 |
| text-spool-out | 0-0 | 0 | 500 | 0 | 0.0 |
| 1st Time | Last Time | # Msgs | Message |
|---|---|---|---|
| 12:25:55 | 12:28:35 | 6 | DNS Fwd/Rev mismatch: lookup of scanner-27.ch1.censys-scanner.com failed |