| |
DIABLO statistics for newsfeed.yoursite.com on Thu 18 Jul 2024 |
Generated on 20240718 2358 by feeder-stats v4.006. Copyright © 2002 The Diablo Project.
Diablo running processes:  81    Dnewslink running processes:  0


11:59PM  up 151 days,  7:18, 0 users, load averages: 1.64, 0.85, 0.61

Filesystem     Size    Used   Avail Capacity  Mounted on
/dev/da0s1g     94G    1.2G     85G     1%    /news
/dev/da1       7.3T    6.6T     73G    99%    /news2/spool/news/00
/dev/da2       7.3T    6.6T     74G    99%    /news2/spool/news/01
/dev/da3       3.7T    3.3T     81G    98%    /news2/spool/news/02
/dev/da4       5.5T      5T     79G    98%    /news2/spool/news/03
/dev/da8       7.3T    6.6T     74G    99%    /news2/spool/news/04
/dev/da9       7.3T    6.6T     74G    99%    /news2/spool/news/05
/dev/da10      7.3T    6.6T     70G    99%    /news2/spool/news/06
/dev/da11      5.5T      5T     74G    99%    /news2/spool/news/07
/dev/da12      5.5T    4.9T     95G    98%    /news2/spool/news/08
/dev/da13      7.3T    6.6T     70G    99%    /news2/spool/news/09
/dev/da14      7.3T    6.6T     70G    99%    /news2/spool/news/10
/dev/da15      7.3T    6.6T     69G    99%    /news2/spool/news/11
/dev/da16      7.3T    6.6T     72G    99%    /news2/spool/news/12
/dev/da17      7.3T    6.6T     71G    99%    /news2/spool/news/13
/dev/da18      7.3T    6.6T     72G    99%    /news2/spool/news/14
/dev/da19      7.3T    6.6T     69G    99%    /news2/spool/news/15
/dev/da20      7.3T    6.6T     67G    99%    /news2/spool/news/16
/dev/da21      7.3T    6.6T     70G    99%    /news2/spool/news/17
/dev/da22      7.3T    6.6T     69G    99%    /news2/spool/news/18
/dev/da23      7.3T    6.6T     68G    99%    /news2/spool/news/19
/dev/da24      7.3T    6.6T     74G    99%    /news2/spool/news/20
/dev/da25      7.3T    6.6T     71G    99%    /news2/spool/news/21
/dev/da26      7.3T    6.6T     71G    99%    /news2/spool/news/22
/dev/da5       221G     35G    168G    17%    /news1
/dev/md0        40G     13G     22G    37%    /news3
| Incoming Feed (+ Top1000 #) | Accepted | %Acc | %Tot | Art/sec | Volume | %Vol | KB/art | Check | Ihave | Spam | TooOld | Rejs | Errs | ||
|---|---|---|---|---|---|---|---|---|---|---|---|---|---|---|---|
| 1 | feeder.ecngs.de | 5243988 | 94.27 | 94.77 | 60.69 | 3.46TB | 99.93 | 709.41 | 5562269 | 0 | 0 | 0 | 182 | 0 | |
| 2 | feeder2.ecngs.de | 289465 | 90.80 | 5.23 | 3.37 | 2.54GB | 0.07 | 9.21 | 318634 | 0 | 0 | 0 | 158 | 0 | |
| Total | 5533453 | 0.00 | 100.00 | 64.07 | 3.47TB | 100.00 | 672.78 | 5880903 | 0 | 0 | 0 | 340 | 0 | ||
 |
| Incoming Feed (+ Top1000 #) | Volume | %Vol | Kbps | Accepted | %Acc | %Tot | KB/art | Check | Ihave | Spam | TooOld | Rejs | Errs | ||
|---|---|---|---|---|---|---|---|---|---|---|---|---|---|---|---|
| 1 | feeder.ecngs.de | 3.46TB | 99.93 | 344456.68 | 5243988 | 94.27 | 94.77 | 709.41 | 5562269 | 0 | 0 | 0 | 182 | 0 | |
| 2 | feeder2.ecngs.de | 2.54GB | 0.07 | 248.61 | 289465 | 90.80 | 5.23 | 9.21 | 318634 | 0 | 0 | 0 | 158 | 0 | |
| Total | 3.47TB | 100.00 | 344705.29 | 5533453 | 0.00 | 100.00 | 672.78 | 5880903 | 0 | 0 | 0 | 340 | 0 | ||
 |
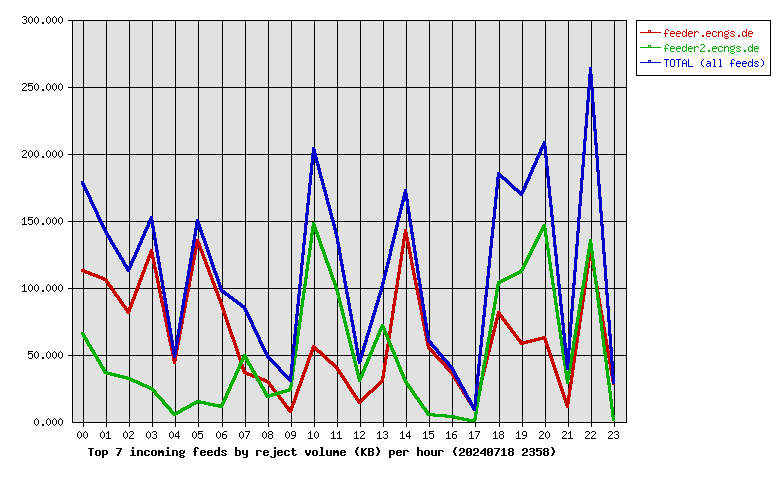
| Incoming Feed (+ Top1000 #) | Rej. Vol. | %Vol | Kbps | Accepted | %Acc | %Tot | KB/art | Check | Ihave | Spam | TooOld | Rejs | Errs | ||
|---|---|---|---|---|---|---|---|---|---|---|---|---|---|---|---|
| 1 | feeder.ecngs.de | 1.48MB | 56.01 | 0.14 | 5243988 | 94.27 | 94.77 | 709.41 | 5562269 | 0 | 0 | 0 | 182 | 0 | |
| 2 | feeder2.ecngs.de | 1.16MB | 43.99 | 0.11 | 289465 | 90.80 | 5.23 | 9.21 | 318634 | 0 | 0 | 0 | 158 | 0 | |
| Total | 2.64MB | 100.00 | 0.25 | 5533453 | 0.00 | 100.00 | 672.78 | 5880903 | 0 | 0 | 0 | 340 | 0 | ||
 |
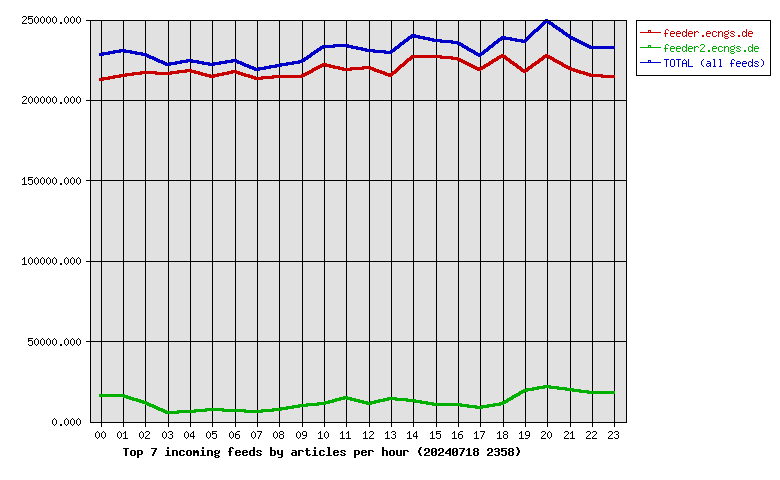
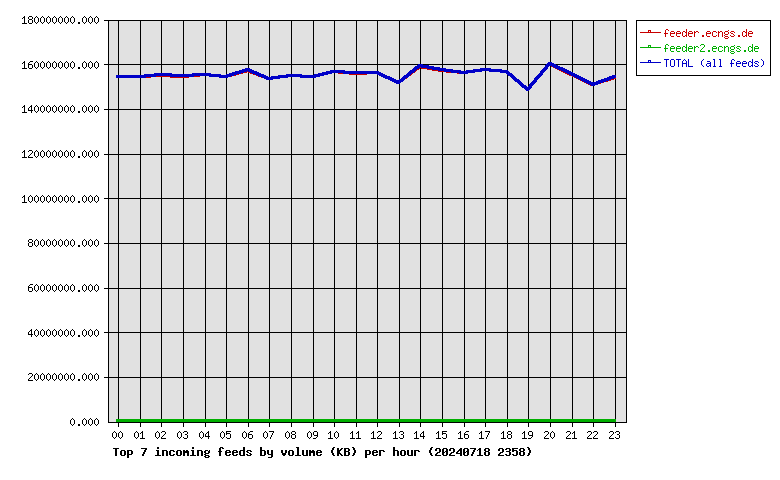
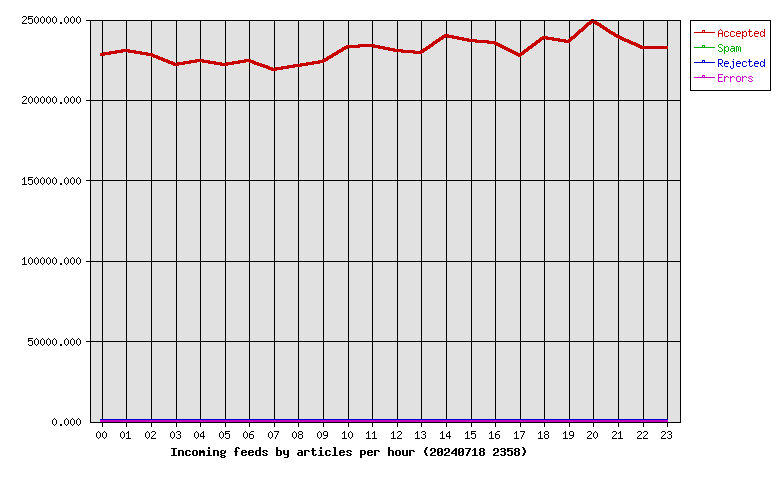
| Hour | Accepted | %Acc | Volume | %Vol | Check | Ihave | Spam | Rejs | Errs |
|---|---|---|---|---|---|---|---|---|---|
| 00 | 227803 | 4.12 | 147.30GB | 4.15 | 246211 | 0 | 0 | 31 | 0 |
| 01 | 230250 | 4.16 | 147.29GB | 4.15 | 248318 | 0 | 0 | 17 | 0 |
| 02 | 228161 | 4.12 | 147.77GB | 4.16 | 241104 | 0 | 0 | 15 | 0 |
| 03 | 221523 | 4.00 | 147.35GB | 4.15 | 227498 | 0 | 0 | 10 | 0 |
| 04 | 224036 | 4.05 | 148.00GB | 4.17 | 231025 | 0 | 0 | 9 | 0 |
| 05 | 221808 | 4.01 | 147.06GB | 4.14 | 242521 | 0 | 0 | 11 | 0 |
| 06 | 224294 | 4.05 | 149.91GB | 4.22 | 231696 | 0 | 0 | 8 | 0 |
| 07 | 218667 | 3.95 | 146.23GB | 4.12 | 225528 | 0 | 0 | 8 | 0 |
| 08 | 220812 | 3.99 | 147.50GB | 4.15 | 228858 | 0 | 0 | 8 | 0 |
| 09 | 223655 | 4.04 | 147.27GB | 4.15 | 234368 | 0 | 0 | 4 | 0 |
| 10 | 232749 | 4.21 | 149.37GB | 4.21 | 245849 | 0 | 0 | 20 | 0 |
| 11 | 233625 | 4.22 | 148.74GB | 4.19 | 250320 | 0 | 0 | 9 | 0 |
| 12 | 230659 | 4.17 | 148.99GB | 4.20 | 242746 | 0 | 0 | 6 | 0 |
| 13 | 229279 | 4.14 | 144.55GB | 4.07 | 245433 | 0 | 0 | 13 | 0 |
| 14 | 239551 | 4.33 | 151.64GB | 4.27 | 256244 | 0 | 0 | 15 | 0 |
| 15 | 236670 | 4.28 | 149.95GB | 4.22 | 247214 | 0 | 0 | 9 | 0 |
| 16 | 235521 | 4.26 | 148.98GB | 4.20 | 248047 | 0 | 0 | 10 | 0 |
| 17 | 227417 | 4.11 | 150.07GB | 4.23 | 236944 | 0 | 0 | 3 | 0 |
| 18 | 238410 | 4.31 | 149.31GB | 4.21 | 251840 | 0 | 0 | 17 | 0 |
| 19 | 235781 | 4.26 | 141.49GB | 3.99 | 257183 | 0 | 0 | 24 | 0 |
| 20 | 248892 | 4.50 | 152.63GB | 4.30 | 273625 | 0 | 0 | 36 | 0 |
| 21 | 239072 | 4.32 | 148.20GB | 4.17 | 261801 | 0 | 0 | 8 | 0 |
| 22 | 232538 | 4.20 | 143.83GB | 4.05 | 254123 | 0 | 0 | 44 | 0 |
| 23 | 232280 | 4.20 | 146.91GB | 4.14 | 252407 | 0 | 0 | 5 | 0 |
| Total | 5533453 | 100.00 | 3.47TB | 100.00 | 5880903 | 0 | 0 | 340 | 0 |
 |
| Outgoing Feed (+ Top1000 #) | Accepted | %Acc | %Tot | Art/sec | Volume | %Vol | KB/art | Dups | Rejs | % Ratio (Out/In) | ||
|---|---|---|---|---|---|---|---|---|---|---|---|---|
| 1 | 217.73.144.40 | 0 | 0.00 | 0.00 | 0.00 | 0.00KB | 0.00 | 0.00 | 5554045 | 0 | … | |
| Total | 0 | 0.00 | 0.00 | 0.00 | 0.00KB | 0.00 | 0.00 | 5554045 | 0 | |||
 |
| Outgoing Feed (+ Top1000 #) | Volume | %Vol | Kbps | Accepted | %Acc | %Tot | KB/art | Dups | Rejs | % Ratio (Out/In) | ||
|---|---|---|---|---|---|---|---|---|---|---|---|---|
| 1 | 217.73.144.40 | 0.00KB | 0.00 | 0.00 | 0 | 0.00 | 0.00 | 0.00 | 5554045 | 0 | … | |
| Total | 0.00KB | 0.00 | 0.00 | 0 | 0.00 | 0.00 | 0.00 | 5554045 | 0 | |||
 |
| Outgoing Feed (+ Top1000 #) | Rej. Vol. | %Vol | Kbps | Accepted | %Acc | %Tot | KB/art | Dups | Rejs | % Ratio (Out/In) | ||
|---|---|---|---|---|---|---|---|---|---|---|---|---|
| 1 | 217.73.144.40 | 0.00KB | 0.00 | 0.00 | 0 | 0.00 | 0.00 | 0.00 | 5554045 | 0 | … | |
| Total | 0.00KB | 0.00 | 0.00 | 0 | 0.00 | 0.00 | 0.00 | 5554045 | 0 | |||
 |
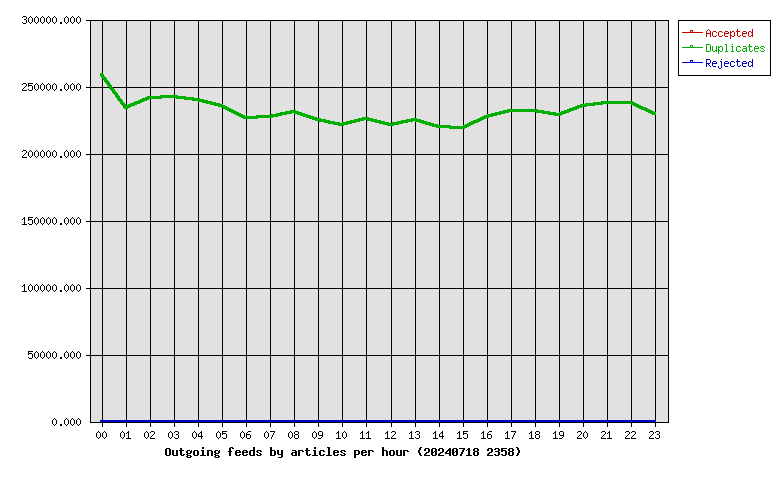
| Hour | Accepted | %Acc | Volume | %Vol | dups | Rejs |
|---|---|---|---|---|---|---|
| 00 | 0 | 0.00 | 0.00KB | 0.00 | 258419 | 0 |
| 01 | 0 | 0.00 | 0.00KB | 0.00 | 234204 | 0 |
| 02 | 0 | 0.00 | 0.00KB | 0.00 | 241237 | 0 |
| 03 | 0 | 0.00 | 0.00KB | 0.00 | 242448 | 0 |
| 04 | 0 | 0.00 | 0.00KB | 0.00 | 239687 | 0 |
| 05 | 0 | 0.00 | 0.00KB | 0.00 | 235374 | 0 |
| 06 | 0 | 0.00 | 0.00KB | 0.00 | 226860 | 0 |
| 07 | 0 | 0.00 | 0.00KB | 0.00 | 226892 | 0 |
| 08 | 0 | 0.00 | 0.00KB | 0.00 | 230745 | 0 |
| 09 | 0 | 0.00 | 0.00KB | 0.00 | 225260 | 0 |
| 10 | 0 | 0.00 | 0.00KB | 0.00 | 221556 | 0 |
| 11 | 0 | 0.00 | 0.00KB | 0.00 | 226093 | 0 |
| 12 | 0 | 0.00 | 0.00KB | 0.00 | 221634 | 0 |
| 13 | 0 | 0.00 | 0.00KB | 0.00 | 224713 | 0 |
| 14 | 0 | 0.00 | 0.00KB | 0.00 | 219769 | 0 |
| 15 | 0 | 0.00 | 0.00KB | 0.00 | 218856 | 0 |
| 16 | 0 | 0.00 | 0.00KB | 0.00 | 227490 | 0 |
| 17 | 0 | 0.00 | 0.00KB | 0.00 | 231499 | 0 |
| 18 | 0 | 0.00 | 0.00KB | 0.00 | 231767 | 0 |
| 19 | 0 | 0.00 | 0.00KB | 0.00 | 229017 | 0 |
| 20 | 0 | 0.00 | 0.00KB | 0.00 | 235608 | 0 |
| 21 | 0 | 0.00 | 0.00KB | 0.00 | 237537 | 0 |
| 22 | 0 | 0.00 | 0.00KB | 0.00 | 237561 | 0 |
| 23 | 0 | 0.00 | 0.00KB | 0.00 | 229819 | 0 |
| Total | 0 | 0.00 | 0.00KB | 0.00 | 5554045 | 0 |
 |
| >= 20% Full | >= 35% Full | >= 50% Full | >= 65% Full | >= 80% Full | >= 95% Full |
| Outgoing Feed | Batch Seq | Batch Num | Batch Max | %Full | Av. Pending |
|---|---|---|---|---|---|
| nbr.elbracht.net-o | 970207-970288 | 81 | 500 | 16 | 0.0 |
| text-spool-out | 0-0 | 0 | 500 | 0 | 0.0 |
| 1st Time | Last Time | # Msgs | Message |
|---|---|---|---|
| 23:36:31 | 23:36:40 | 3 | DNS Fwd/Rev mismatch: lookup of unused-space.coop.net failed |
| 04:05:06 | 04:05:14 | 3 | DNS Fwd/Rev mismatch: lookup of scanner-06.ch1.censys-scanner.com failed |