| |
DIABLO statistics for newsfeed.yoursite.com on Wed 17 Jul 2024 |
Generated on 20240717 2358 by feeder-stats v4.006. Copyright © 2002 The Diablo Project.
Diablo running processes:  81    Dnewslink running processes:  0


11:59PM  up 150 days,  7:18, 0 users, load averages: 1.78, 0.99, 0.76

Filesystem     Size    Used   Avail Capacity  Mounted on
/dev/da0s1g     94G    1.2G     85G     1%    /news
/dev/da1       7.3T    6.6T    113G    98%    /news2/spool/news/00
/dev/da2       7.3T    6.6T    115G    98%    /news2/spool/news/01
/dev/da3       3.7T    3.3T     71G    98%    /news2/spool/news/02
/dev/da4       5.5T      5T     73G    99%    /news2/spool/news/03
/dev/da8       7.3T    6.6T    114G    98%    /news2/spool/news/04
/dev/da9       7.3T    6.6T    115G    98%    /news2/spool/news/05
/dev/da10      7.3T    6.6T    110G    98%    /news2/spool/news/06
/dev/da11      5.5T    4.9T    117G    98%    /news2/spool/news/07
/dev/da12      5.5T      5T     81G    98%    /news2/spool/news/08
/dev/da13      7.3T    6.6T    110G    98%    /news2/spool/news/09
/dev/da14      7.3T    6.6T    111G    98%    /news2/spool/news/10
/dev/da15      7.3T    6.6T    109G    98%    /news2/spool/news/11
/dev/da16      7.3T    6.6T    112G    98%    /news2/spool/news/12
/dev/da17      7.3T    6.6T    112G    98%    /news2/spool/news/13
/dev/da18      7.3T    6.6T    112G    98%    /news2/spool/news/14
/dev/da19      7.3T    6.6T    111G    98%    /news2/spool/news/15
/dev/da20      7.3T    6.6T    108G    98%    /news2/spool/news/16
/dev/da21      7.3T    6.6T    110G    98%    /news2/spool/news/17
/dev/da22      7.3T    6.6T    110G    98%    /news2/spool/news/18
/dev/da23      7.3T    6.6T    107G    98%    /news2/spool/news/19
/dev/da24      7.3T    6.6T    115G    98%    /news2/spool/news/20
/dev/da25      7.3T    6.6T    112G    98%    /news2/spool/news/21
/dev/da26      7.3T    6.6T    111G    98%    /news2/spool/news/22
/dev/da5       221G     35G    168G    17%    /news1
/dev/md0        40G     13G     22G    37%    /news3
| Incoming Feed (+ Top1000 #) | Accepted | %Acc | %Tot | Art/sec | Volume | %Vol | KB/art | Check | Ihave | Spam | TooOld | Rejs | Errs | ||
|---|---|---|---|---|---|---|---|---|---|---|---|---|---|---|---|
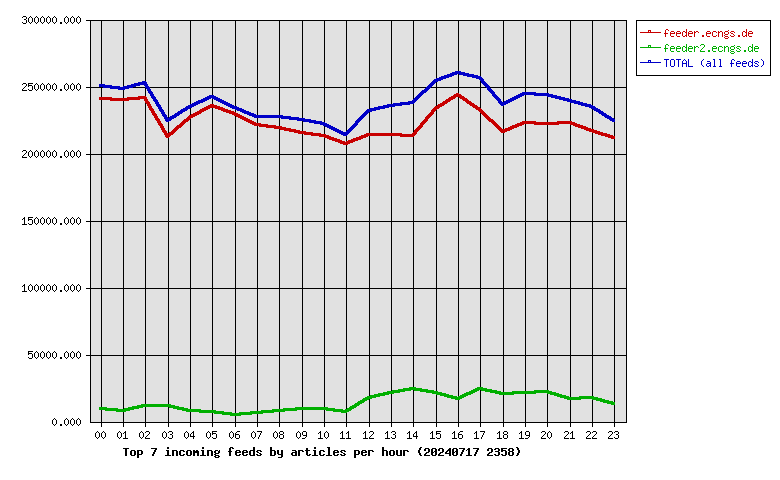
| 1 | feeder.ecngs.de | 5363856 | 93.55 | 94.09 | 62.08 | 3.58TB | 99.92 | 716.32 | 5733510 | 0 | 0 | 0 | 214 | 0 | |
| 2 | feeder2.ecngs.de | 336802 | 91.39 | 5.91 | 3.93 | 2.95GB | 0.08 | 9.19 | 368334 | 0 | 0 | 0 | 189 | 0 | |
| Total | 5700658 | 0.00 | 100.00 | 66.01 | 3.58TB | 100.00 | 674.54 | 6101844 | 0 | 0 | 0 | 403 | 0 | ||
 |
| Incoming Feed (+ Top1000 #) | Volume | %Vol | Kbps | Accepted | %Acc | %Tot | KB/art | Check | Ihave | Spam | TooOld | Rejs | Errs | ||
|---|---|---|---|---|---|---|---|---|---|---|---|---|---|---|---|
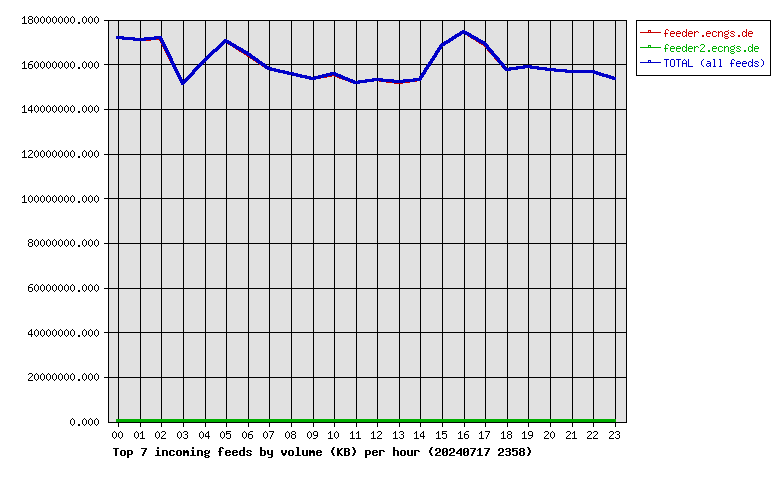
| 1 | feeder.ecngs.de | 3.58TB | 99.92 | 355762.52 | 5363856 | 93.55 | 94.09 | 716.32 | 5733510 | 0 | 0 | 0 | 214 | 0 | |
| 2 | feeder2.ecngs.de | 2.95GB | 0.08 | 288.44 | 336802 | 91.39 | 5.91 | 9.19 | 368334 | 0 | 0 | 0 | 189 | 0 | |
| Total | 3.58TB | 100.00 | 356050.96 | 5700658 | 0.00 | 100.00 | 674.54 | 6101844 | 0 | 0 | 0 | 403 | 0 | ||
 |
| Incoming Feed (+ Top1000 #) | Rej. Vol. | %Vol | Kbps | Accepted | %Acc | %Tot | KB/art | Check | Ihave | Spam | TooOld | Rejs | Errs | ||
|---|---|---|---|---|---|---|---|---|---|---|---|---|---|---|---|
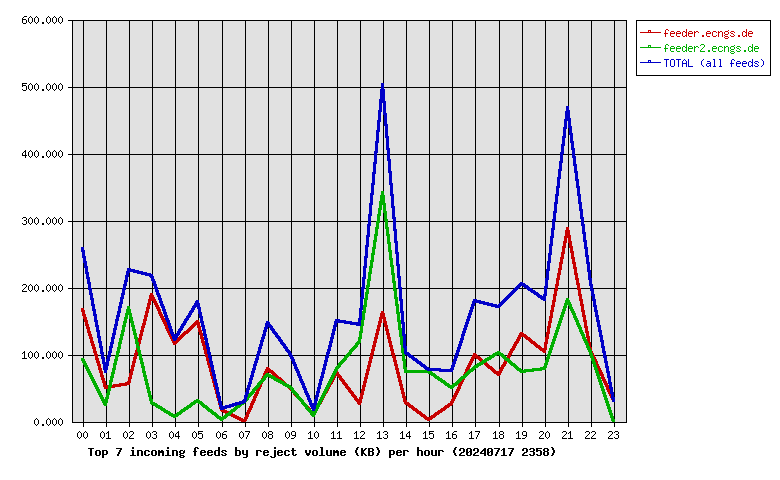
| 1 | feeder.ecngs.de | 1.97MB | 52.07 | 0.19 | 5363856 | 93.55 | 94.09 | 716.32 | 5733510 | 0 | 0 | 0 | 214 | 0 | |
| 2 | feeder2.ecngs.de | 1.82MB | 47.93 | 0.17 | 336802 | 91.39 | 5.91 | 9.19 | 368334 | 0 | 0 | 0 | 189 | 0 | |
| Total | 3.79MB | 100.00 | 0.36 | 5700658 | 0.00 | 100.00 | 674.54 | 6101844 | 0 | 0 | 0 | 403 | 0 | ||
 |
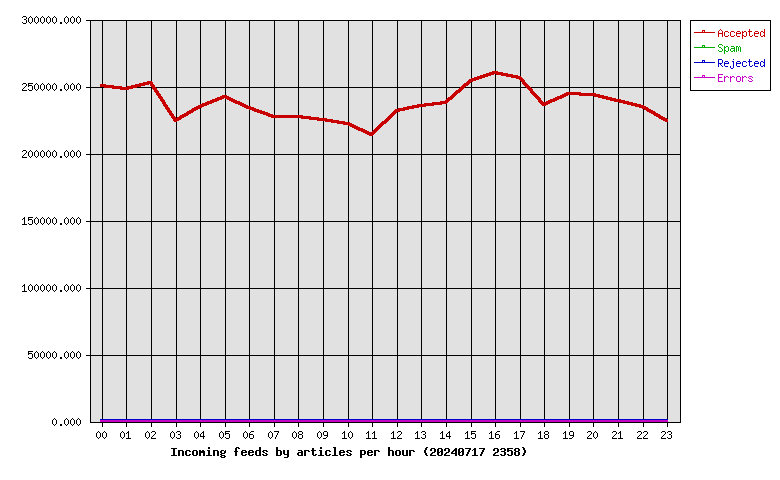
| Hour | Accepted | %Acc | Volume | %Vol | Check | Ihave | Spam | Rejs | Errs |
|---|---|---|---|---|---|---|---|---|---|
| 00 | 250151 | 4.39 | 163.76GB | 4.47 | 261683 | 0 | 0 | 18 | 0 |
| 01 | 247987 | 4.35 | 163.09GB | 4.45 | 256701 | 0 | 0 | 8 | 0 |
| 02 | 252714 | 4.43 | 163.61GB | 4.46 | 264893 | 0 | 0 | 16 | 0 |
| 03 | 224460 | 3.94 | 144.24GB | 3.93 | 237248 | 0 | 0 | 12 | 0 |
| 04 | 234619 | 4.12 | 153.92GB | 4.20 | 245727 | 0 | 0 | 9 | 0 |
| 05 | 242193 | 4.25 | 162.47GB | 4.43 | 264574 | 0 | 0 | 8 | 0 |
| 06 | 234153 | 4.11 | 156.75GB | 4.27 | 239464 | 0 | 0 | 6 | 0 |
| 07 | 227217 | 3.99 | 150.49GB | 4.10 | 234306 | 0 | 0 | 4 | 0 |
| 08 | 227050 | 3.98 | 148.44GB | 4.05 | 235941 | 0 | 0 | 17 | 0 |
| 09 | 225312 | 3.95 | 146.35GB | 3.99 | 236189 | 0 | 0 | 9 | 0 |
| 10 | 222329 | 3.90 | 148.26GB | 4.04 | 233176 | 0 | 0 | 8 | 0 |
| 11 | 213978 | 3.75 | 144.52GB | 3.94 | 222387 | 0 | 0 | 14 | 0 |
| 12 | 231367 | 4.06 | 145.90GB | 3.98 | 251258 | 0 | 0 | 17 | 0 |
| 13 | 235500 | 4.13 | 144.85GB | 3.95 | 259943 | 0 | 0 | 45 | 0 |
| 14 | 237811 | 4.17 | 145.88GB | 3.98 | 265029 | 0 | 0 | 14 | 0 |
| 15 | 254371 | 4.46 | 160.38GB | 4.37 | 275016 | 0 | 0 | 9 | 0 |
| 16 | 260333 | 4.57 | 166.30GB | 4.53 | 281938 | 0 | 0 | 5 | 0 |
| 17 | 256468 | 4.50 | 161.05GB | 4.39 | 283928 | 0 | 0 | 22 | 0 |
| 18 | 236052 | 4.14 | 150.29GB | 4.10 | 258821 | 0 | 0 | 18 | 0 |
| 19 | 244264 | 4.28 | 151.36GB | 4.13 | 269829 | 0 | 0 | 26 | 0 |
| 20 | 243621 | 4.27 | 150.28GB | 4.10 | 268408 | 0 | 0 | 29 | 0 |
| 21 | 239415 | 4.20 | 149.34GB | 4.07 | 261476 | 0 | 0 | 76 | 0 |
| 22 | 234939 | 4.12 | 149.29GB | 4.07 | 254309 | 0 | 0 | 12 | 0 |
| 23 | 224354 | 3.94 | 146.37GB | 3.99 | 239600 | 0 | 0 | 1 | 0 |
| Total | 5700658 | 100.00 | 3.58TB | 100.00 | 6101844 | 0 | 0 | 403 | 0 |
 |
| Outgoing Feed (+ Top1000 #) | Accepted | %Acc | %Tot | Art/sec | Volume | %Vol | KB/art | Dups | Rejs | % Ratio (Out/In) | ||
|---|---|---|---|---|---|---|---|---|---|---|---|---|
| 1 | 217.73.144.40 | 0 | 0.00 | 0.00 | 0.00 | 0.00KB | 0.00 | 0.00 | 5724545 | 0 | … | |
| Total | 0 | 0.00 | 0.00 | 0.00 | 0.00KB | 0.00 | 0.00 | 5724545 | 0 | |||
 |
| Outgoing Feed (+ Top1000 #) | Volume | %Vol | Kbps | Accepted | %Acc | %Tot | KB/art | Dups | Rejs | % Ratio (Out/In) | ||
|---|---|---|---|---|---|---|---|---|---|---|---|---|
| 1 | 217.73.144.40 | 0.00KB | 0.00 | 0.00 | 0 | 0.00 | 0.00 | 0.00 | 5724545 | 0 | … | |
| Total | 0.00KB | 0.00 | 0.00 | 0 | 0.00 | 0.00 | 0.00 | 5724545 | 0 | |||
 |
| Outgoing Feed (+ Top1000 #) | Rej. Vol. | %Vol | Kbps | Accepted | %Acc | %Tot | KB/art | Dups | Rejs | % Ratio (Out/In) | ||
|---|---|---|---|---|---|---|---|---|---|---|---|---|
| 1 | 217.73.144.40 | 0.00KB | 0.00 | 0.00 | 0 | 0.00 | 0.00 | 0.00 | 5724545 | 0 | … | |
| Total | 0.00KB | 0.00 | 0.00 | 0 | 0.00 | 0.00 | 0.00 | 5724545 | 0 | |||
 |
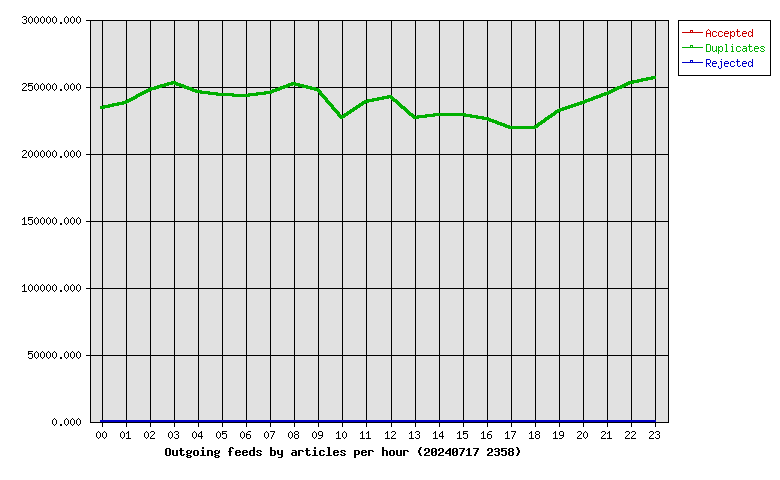
| Hour | Accepted | %Acc | Volume | %Vol | dups | Rejs |
|---|---|---|---|---|---|---|
| 00 | 0 | 0.00 | 0.00KB | 0.00 | 233704 | 0 |
| 01 | 0 | 0.00 | 0.00KB | 0.00 | 237760 | 0 |
| 02 | 0 | 0.00 | 0.00KB | 0.00 | 247203 | 0 |
| 03 | 0 | 0.00 | 0.00KB | 0.00 | 252756 | 0 |
| 04 | 0 | 0.00 | 0.00KB | 0.00 | 245756 | 0 |
| 05 | 0 | 0.00 | 0.00KB | 0.00 | 243555 | 0 |
| 06 | 0 | 0.00 | 0.00KB | 0.00 | 242594 | 0 |
| 07 | 0 | 0.00 | 0.00KB | 0.00 | 245144 | 0 |
| 08 | 0 | 0.00 | 0.00KB | 0.00 | 251957 | 0 |
| 09 | 0 | 0.00 | 0.00KB | 0.00 | 247111 | 0 |
| 10 | 0 | 0.00 | 0.00KB | 0.00 | 226549 | 0 |
| 11 | 0 | 0.00 | 0.00KB | 0.00 | 238466 | 0 |
| 12 | 0 | 0.00 | 0.00KB | 0.00 | 241930 | 0 |
| 13 | 0 | 0.00 | 0.00KB | 0.00 | 226611 | 0 |
| 14 | 0 | 0.00 | 0.00KB | 0.00 | 228589 | 0 |
| 15 | 0 | 0.00 | 0.00KB | 0.00 | 228648 | 0 |
| 16 | 0 | 0.00 | 0.00KB | 0.00 | 226101 | 0 |
| 17 | 0 | 0.00 | 0.00KB | 0.00 | 218687 | 0 |
| 18 | 0 | 0.00 | 0.00KB | 0.00 | 218881 | 0 |
| 19 | 0 | 0.00 | 0.00KB | 0.00 | 231501 | 0 |
| 20 | 0 | 0.00 | 0.00KB | 0.00 | 237757 | 0 |
| 21 | 0 | 0.00 | 0.00KB | 0.00 | 244430 | 0 |
| 22 | 0 | 0.00 | 0.00KB | 0.00 | 252528 | 0 |
| 23 | 0 | 0.00 | 0.00KB | 0.00 | 256327 | 0 |
| Total | 0 | 0.00 | 0.00KB | 0.00 | 5724545 | 0 |
 |
| >= 20% Full | >= 35% Full | >= 50% Full | >= 65% Full | >= 80% Full | >= 95% Full |
| Outgoing Feed | Batch Seq | Batch Num | Batch Max | %Full | Av. Pending |
|---|---|---|---|---|---|
| nbr.elbracht.net-o | 969919-970000 | 81 | 500 | 16 | 0.0 |
| text-spool-out | 0-0 | 0 | 500 | 0 | 0.0 |
| 1st Time | Last Time | # Msgs | Message |
|---|