| |
DIABLO statistics for newsfeed.yoursite.com on Tue 16 Jul 2024 |
Generated on 20240716 2358 by feeder-stats v4.006. Copyright © 2002 The Diablo Project.
Diablo running processes:  81    Dnewslink running processes:  0


11:59PM  up 149 days,  7:18, 0 users, load averages: 1.12, 0.75, 0.59

Filesystem     Size    Used   Avail Capacity  Mounted on
/dev/da0s1g     94G    1.2G     85G     1%    /news
/dev/da1       7.3T    6.6T    100G    99%    /news2/spool/news/00
/dev/da2       7.3T    6.6T    103G    98%    /news2/spool/news/01
/dev/da3       3.7T    3.3T     71G    98%    /news2/spool/news/02
/dev/da4       5.5T      5T     72G    99%    /news2/spool/news/03
/dev/da8       7.3T    6.6T    102G    99%    /news2/spool/news/04
/dev/da9       7.3T    6.6T    102G    99%    /news2/spool/news/05
/dev/da10      7.3T    6.6T     98G    99%    /news2/spool/news/06
/dev/da11      5.5T    4.9T    100G    98%    /news2/spool/news/07
/dev/da12      5.5T      5T     74G    99%    /news2/spool/news/08
/dev/da13      7.3T    6.6T     97G    99%    /news2/spool/news/09
/dev/da14      7.3T    6.6T     98G    99%    /news2/spool/news/10
/dev/da15      7.3T    6.6T     97G    99%    /news2/spool/news/11
/dev/da16      7.3T    6.6T     99G    99%    /news2/spool/news/12
/dev/da17      7.3T    6.6T    100G    99%    /news2/spool/news/13
/dev/da18      7.3T    6.6T    100G    99%    /news2/spool/news/14
/dev/da19      7.3T    6.6T     98G    99%    /news2/spool/news/15
/dev/da20      7.3T    6.6T     96G    99%    /news2/spool/news/16
/dev/da21      7.3T    6.6T     99G    99%    /news2/spool/news/17
/dev/da22      7.3T    6.6T     98G    99%    /news2/spool/news/18
/dev/da23      7.3T    6.6T     95G    99%    /news2/spool/news/19
/dev/da24      7.3T    6.6T    102G    98%    /news2/spool/news/20
/dev/da25      7.3T    6.6T     99G    99%    /news2/spool/news/21
/dev/da26      7.3T    6.6T     99G    99%    /news2/spool/news/22
/dev/da5       221G     35G    168G    17%    /news1
/dev/md0        40G     13G     22G    37%    /news3
| Incoming Feed (+ Top1000 #) | Accepted | %Acc | %Tot | Art/sec | Volume | %Vol | KB/art | Check | Ihave | Spam | TooOld | Rejs | Errs | ||
|---|---|---|---|---|---|---|---|---|---|---|---|---|---|---|---|
| 1 | feeder.ecngs.de | 5302945 | 94.74 | 95.16 | 61.38 | 3.54TB | 99.94 | 717.46 | 5596942 | 0 | 0 | 0 | 173 | 0 | |
| 2 | feeder2.ecngs.de | 269664 | 91.30 | 4.84 | 3.14 | 2.33GB | 0.06 | 9.05 | 295237 | 0 | 0 | 0 | 129 | 0 | |
| Total | 5572609 | 0.00 | 100.00 | 64.51 | 3.55TB | 100.00 | 683.18 | 5892179 | 0 | 0 | 0 | 302 | 0 | ||
 |
| Incoming Feed (+ Top1000 #) | Volume | %Vol | Kbps | Accepted | %Acc | %Tot | KB/art | Check | Ihave | Spam | TooOld | Rejs | Errs | ||
|---|---|---|---|---|---|---|---|---|---|---|---|---|---|---|---|
| 1 | feeder.ecngs.de | 3.54TB | 99.94 | 352284.32 | 5302945 | 94.74 | 95.16 | 717.46 | 5596942 | 0 | 0 | 0 | 173 | 0 | |
| 2 | feeder2.ecngs.de | 2.33GB | 0.06 | 226.98 | 269664 | 91.30 | 4.84 | 9.05 | 295237 | 0 | 0 | 0 | 129 | 0 | |
| Total | 3.55TB | 100.00 | 352511.30 | 5572609 | 0.00 | 100.00 | 683.18 | 5892179 | 0 | 0 | 0 | 302 | 0 | ||
 |
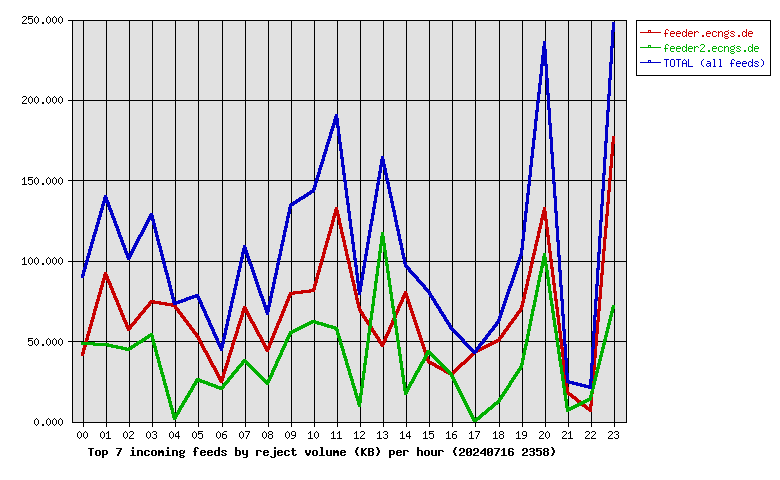
| Incoming Feed (+ Top1000 #) | Rej. Vol. | %Vol | Kbps | Accepted | %Acc | %Tot | KB/art | Check | Ihave | Spam | TooOld | Rejs | Errs | ||
|---|---|---|---|---|---|---|---|---|---|---|---|---|---|---|---|
| 1 | feeder.ecngs.de | 1.54MB | 62.86 | 0.15 | 5302945 | 94.74 | 95.16 | 717.46 | 5596942 | 0 | 0 | 0 | 173 | 0 | |
| 2 | feeder2.ecngs.de | 933.05KB | 37.14 | 0.09 | 269664 | 91.30 | 4.84 | 9.05 | 295237 | 0 | 0 | 0 | 129 | 0 | |
| Total | 2.45MB | 100.00 | 0.23 | 5572609 | 0.00 | 100.00 | 683.18 | 5892179 | 0 | 0 | 0 | 302 | 0 | ||
 |
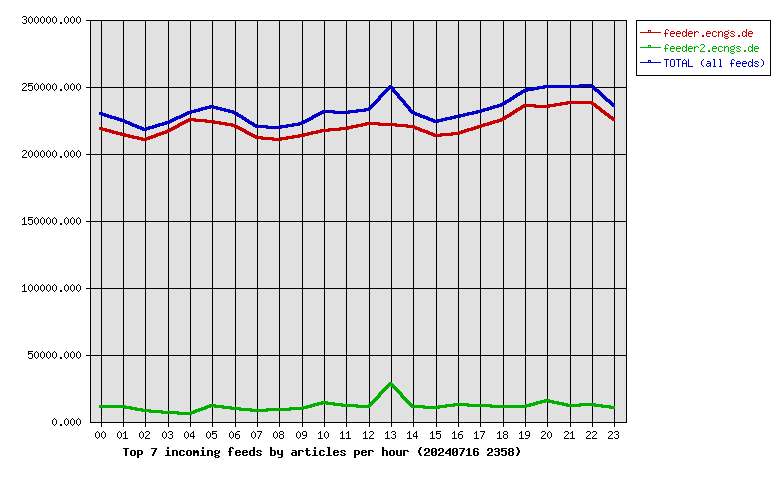
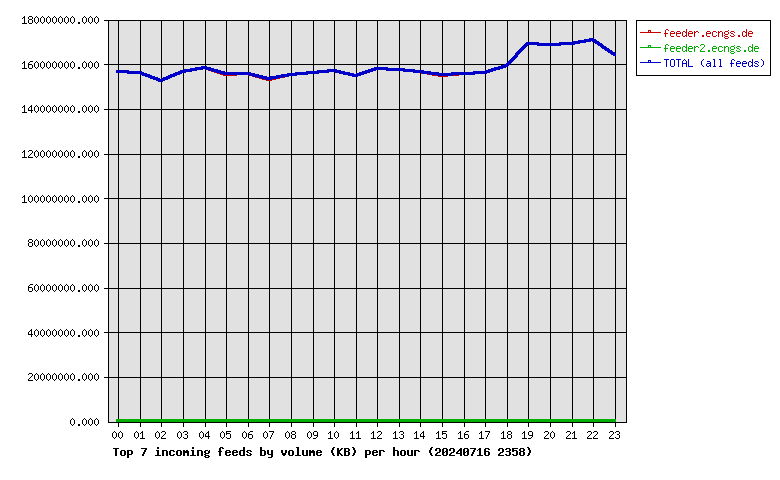
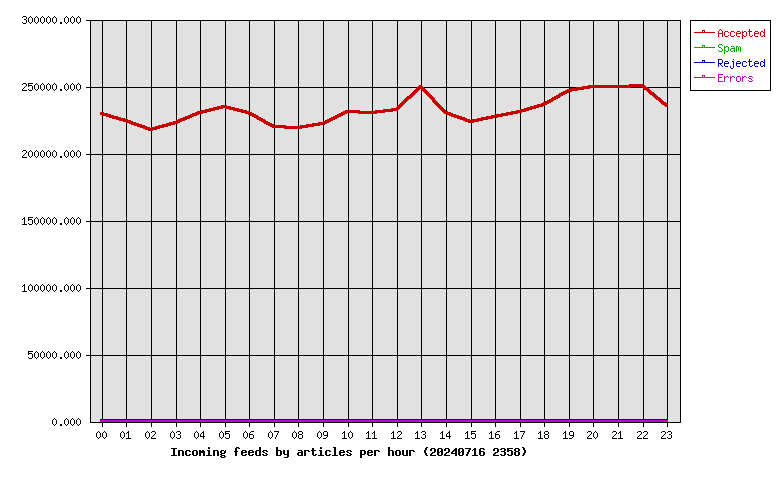
| Hour | Accepted | %Acc | Volume | %Vol | Check | Ihave | Spam | Rejs | Errs |
|---|---|---|---|---|---|---|---|---|---|
| 00 | 229422 | 4.12 | 149.17GB | 4.11 | 241952 | 0 | 0 | 10 | 0 |
| 01 | 224521 | 4.03 | 148.86GB | 4.10 | 236802 | 0 | 0 | 14 | 0 |
| 02 | 217814 | 3.91 | 145.48GB | 4.01 | 226759 | 0 | 0 | 11 | 0 |
| 03 | 222575 | 3.99 | 149.29GB | 4.11 | 229198 | 0 | 0 | 10 | 0 |
| 04 | 230269 | 4.13 | 150.97GB | 4.16 | 237631 | 0 | 0 | 9 | 0 |
| 05 | 234951 | 4.22 | 148.21GB | 4.08 | 258133 | 0 | 0 | 10 | 0 |
| 06 | 230243 | 4.13 | 148.60GB | 4.09 | 241604 | 0 | 0 | 8 | 0 |
| 07 | 219637 | 3.94 | 146.10GB | 4.02 | 228670 | 0 | 0 | 12 | 0 |
| 08 | 218712 | 3.92 | 147.89GB | 4.07 | 227973 | 0 | 0 | 9 | 0 |
| 09 | 222344 | 3.99 | 148.68GB | 4.10 | 232760 | 0 | 0 | 14 | 0 |
| 10 | 230872 | 4.14 | 149.57GB | 4.12 | 246684 | 0 | 0 | 14 | 0 |
| 11 | 230188 | 4.13 | 147.59GB | 4.06 | 243849 | 0 | 0 | 22 | 0 |
| 12 | 232689 | 4.18 | 150.67GB | 4.15 | 245123 | 0 | 0 | 13 | 0 |
| 13 | 249282 | 4.47 | 150.30GB | 4.14 | 281665 | 0 | 0 | 28 | 0 |
| 14 | 230235 | 4.13 | 149.38GB | 4.11 | 242469 | 0 | 0 | 14 | 0 |
| 15 | 223261 | 4.01 | 147.76GB | 4.07 | 233896 | 0 | 0 | 8 | 0 |
| 16 | 226871 | 4.07 | 148.57GB | 4.09 | 241823 | 0 | 0 | 7 | 0 |
| 17 | 230975 | 4.14 | 148.85GB | 4.10 | 244159 | 0 | 0 | 3 | 0 |
| 18 | 236063 | 4.24 | 151.82GB | 4.18 | 248345 | 0 | 0 | 7 | 0 |
| 19 | 246658 | 4.43 | 161.17GB | 4.44 | 259685 | 0 | 0 | 21 | 0 |
| 20 | 249982 | 4.49 | 160.95GB | 4.43 | 268499 | 0 | 0 | 26 | 0 |
| 21 | 249566 | 4.48 | 161.15GB | 4.44 | 262751 | 0 | 0 | 8 | 0 |
| 22 | 250180 | 4.49 | 163.02GB | 4.49 | 264832 | 0 | 0 | 6 | 0 |
| 23 | 235299 | 4.22 | 156.70GB | 4.32 | 246917 | 0 | 0 | 18 | 0 |
| Total | 5572609 | 100.00 | 3.55TB | 100.00 | 5892179 | 0 | 0 | 302 | 0 |
 |
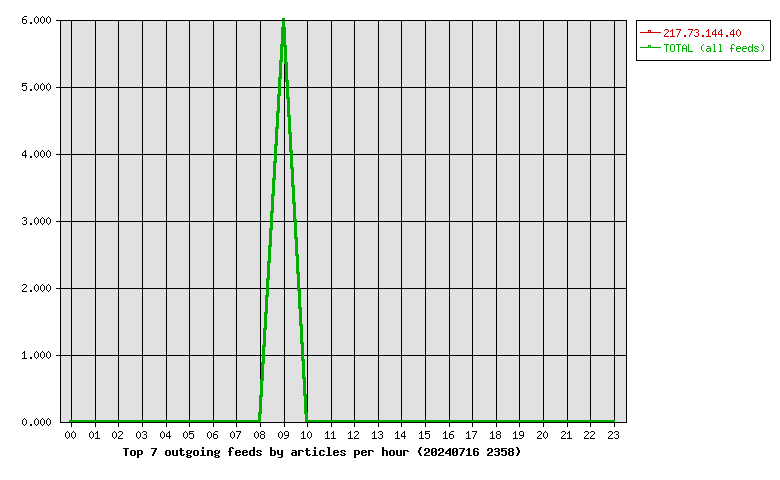
| Outgoing Feed (+ Top1000 #) | Accepted | %Acc | %Tot | Art/sec | Volume | %Vol | KB/art | Dups | Rejs | % Ratio (Out/In) | ||
|---|---|---|---|---|---|---|---|---|---|---|---|---|
| 1 | 217.73.144.40 | 6 | 0.00 | 100.00 | 0.00 | 3.63KB | 100.00 | 0.60 | 5456954 | 0 | … | |
| Total | 6 | 0.00 | 100.00 | 0.00 | 3.63KB | 100.00 | 0.60 | 5456954 | 0 | 0.00 | ||
 |
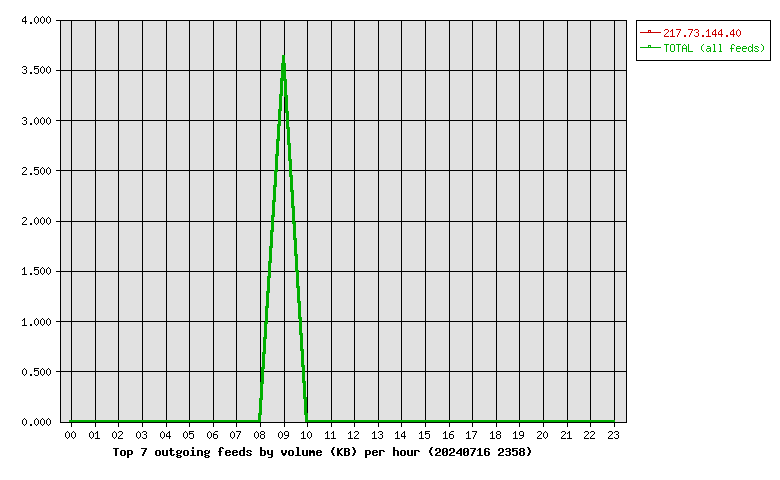
| Outgoing Feed (+ Top1000 #) | Volume | %Vol | Kbps | Accepted | %Acc | %Tot | KB/art | Dups | Rejs | % Ratio (Out/In) | ||
|---|---|---|---|---|---|---|---|---|---|---|---|---|
| 1 | 217.73.144.40 | 3.63KB | 100.00 | 0.02 | 6 | 0.00 | 100.00 | 0.60 | 5456954 | 0 | … | |
| Total | 3.63KB | 100.00 | 0.02 | 6 | 0.00 | 100.00 | 0.60 | 5456954 | 0 | 0.00 | ||
 |
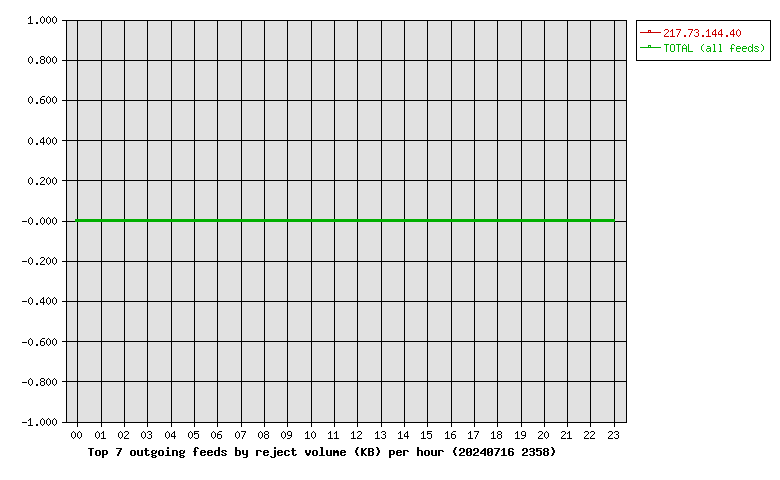
| Outgoing Feed (+ Top1000 #) | Rej. Vol. | %Vol | Kbps | Accepted | %Acc | %Tot | KB/art | Dups | Rejs | % Ratio (Out/In) | ||
|---|---|---|---|---|---|---|---|---|---|---|---|---|
| 1 | 217.73.144.40 | 0.00KB | 0.00 | 0.00 | 6 | 0.00 | 100.00 | 0.60 | 5456954 | 0 | … | |
| Total | 0.00KB | 0.00 | 0.00 | 6 | 0.00 | 100.00 | 0.60 | 5456954 | 0 | 0.00 | ||
 |
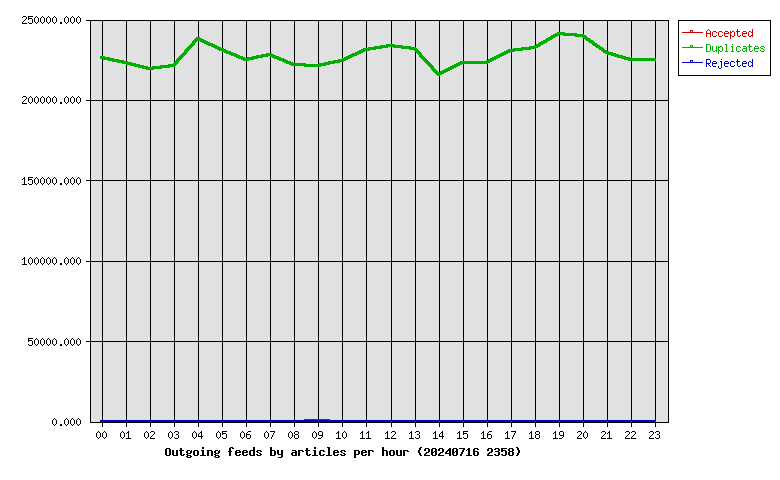
| Hour | Accepted | %Acc | Volume | %Vol | dups | Rejs |
|---|---|---|---|---|---|---|
| 00 | 0 | 0.00 | 0.00KB | 0.00 | 226125 | 0 |
| 01 | 0 | 0.00 | 0.00KB | 0.00 | 223203 | 0 |
| 02 | 0 | 0.00 | 0.00KB | 0.00 | 219250 | 0 |
| 03 | 0 | 0.00 | 0.00KB | 0.00 | 220962 | 0 |
| 04 | 0 | 0.00 | 0.00KB | 0.00 | 237638 | 0 |
| 05 | 0 | 0.00 | 0.00KB | 0.00 | 231204 | 0 |
| 06 | 0 | 0.00 | 0.00KB | 0.00 | 224562 | 0 |
| 07 | 0 | 0.00 | 0.00KB | 0.00 | 227725 | 0 |
| 08 | 0 | 0.00 | 0.00KB | 0.00 | 221460 | 0 |
| 09 | 6 | 100.00 | 3.63KB | 100.00 | 220786 | 0 |
| 10 | 0 | 0.00 | 0.00KB | 0.00 | 223910 | 0 |
| 11 | 0 | 0.00 | 0.00KB | 0.00 | 231077 | 0 |
| 12 | 0 | 0.00 | 0.00KB | 0.00 | 233316 | 0 |
| 13 | 0 | 0.00 | 0.00KB | 0.00 | 231923 | 0 |
| 14 | 0 | 0.00 | 0.00KB | 0.00 | 215540 | 0 |
| 15 | 0 | 0.00 | 0.00KB | 0.00 | 223215 | 0 |
| 16 | 0 | 0.00 | 0.00KB | 0.00 | 223233 | 0 |
| 17 | 0 | 0.00 | 0.00KB | 0.00 | 230273 | 0 |
| 18 | 0 | 0.00 | 0.00KB | 0.00 | 232023 | 0 |
| 19 | 0 | 0.00 | 0.00KB | 0.00 | 240992 | 0 |
| 20 | 0 | 0.00 | 0.00KB | 0.00 | 239997 | 0 |
| 21 | 0 | 0.00 | 0.00KB | 0.00 | 229037 | 0 |
| 22 | 0 | 0.00 | 0.00KB | 0.00 | 224848 | 0 |
| 23 | 0 | 0.00 | 0.00KB | 0.00 | 224655 | 0 |
| Total | 6 | 100.00 | 3.63KB | 100.00 | 5456954 | 0 |
 |
| >= 20% Full | >= 35% Full | >= 50% Full | >= 65% Full | >= 80% Full | >= 95% Full |
| Outgoing Feed | Batch Seq | Batch Num | Batch Max | %Full | Av. Pending |
|---|---|---|---|---|---|
| nbr.elbracht.net-o | 969631-969712 | 81 | 500 | 16 | 0.0 |
| text-spool-out | 0-0 | 0 | 500 | 0 | 0.0 |
| 1st Time | Last Time | # Msgs | Message |
|---|---|---|---|
| 23:48:27 | 1 | DNS Fwd/Rev mismatch: lookup of unused-space.coop.net failed |