| |
DIABLO statistics for newsfeed.yoursite.com on Mon 15 Jul 2024 |
Generated on 20240715 2358 by feeder-stats v4.006. Copyright © 2002 The Diablo Project.
Diablo running processes:  81    Dnewslink running processes:  0


11:59PM  up 148 days,  7:18, 0 users, load averages: 1.46, 0.93, 0.80

Filesystem     Size    Used   Avail Capacity  Mounted on
/dev/da0s1g     94G    1.2G     85G     1%    /news
/dev/da1       7.3T    6.6T     87G    99%    /news2/spool/news/00
/dev/da2       7.3T    6.6T     90G    99%    /news2/spool/news/01
/dev/da3       3.7T    3.3T     71G    98%    /news2/spool/news/02
/dev/da4       5.5T      5T     67G    99%    /news2/spool/news/03
/dev/da8       7.3T    6.6T     89G    99%    /news2/spool/news/04
/dev/da9       7.3T    6.6T     88G    99%    /news2/spool/news/05
/dev/da10      7.3T    6.6T     84G    99%    /news2/spool/news/06
/dev/da11      5.5T      5T     87G    98%    /news2/spool/news/07
/dev/da12      5.5T      5T     68G    99%    /news2/spool/news/08
/dev/da13      7.3T    6.6T     85G    99%    /news2/spool/news/09
/dev/da14      7.3T    6.6T     85G    99%    /news2/spool/news/10
/dev/da15      7.3T    6.6T     86G    99%    /news2/spool/news/11
/dev/da16      7.3T    6.6T     86G    99%    /news2/spool/news/12
/dev/da17      7.3T    6.6T     87G    99%    /news2/spool/news/13
/dev/da18      7.3T    6.6T     88G    99%    /news2/spool/news/14
/dev/da19      7.3T    6.6T     85G    99%    /news2/spool/news/15
/dev/da20      7.3T    6.6T     83G    99%    /news2/spool/news/16
/dev/da21      7.3T    6.6T     86G    99%    /news2/spool/news/17
/dev/da22      7.3T    6.6T     84G    99%    /news2/spool/news/18
/dev/da23      7.3T    6.6T     83G    99%    /news2/spool/news/19
/dev/da24      7.3T    6.6T     89G    99%    /news2/spool/news/20
/dev/da25      7.3T    6.6T     87G    99%    /news2/spool/news/21
/dev/da26      7.3T    6.6T     86G    99%    /news2/spool/news/22
/dev/da5       221G     35G    168G    17%    /news1
/dev/md0        40G     14G     21G    40%    /news3
| Incoming Feed (+ Top1000 #) | Accepted | %Acc | %Tot | Art/sec | Volume | %Vol | KB/art | Check | Ihave | Spam | TooOld | Rejs | Errs | ||
|---|---|---|---|---|---|---|---|---|---|---|---|---|---|---|---|
| 1 | feeder.ecngs.de | 8063934 | 96.01 | 97.52 | 93.33 | 5.39TB | 99.97 | 717.91 | 8345370 | 0 | 0 | 0 | 53716 | 0 | |
| 2 | feeder2.ecngs.de | 205160 | 89.63 | 2.48 | 2.38 | 1.53GB | 0.03 | 7.84 | 228724 | 0 | 0 | 0 | 183 | 0 | |
| Total | 8269094 | 0.00 | 100.00 | 95.72 | 5.39TB | 100.00 | 700.30 | 8574094 | 0 | 0 | 0 | 53899 | 0 | ||
 |
| Incoming Feed (+ Top1000 #) | Volume | %Vol | Kbps | Accepted | %Acc | %Tot | KB/art | Check | Ihave | Spam | TooOld | Rejs | Errs | ||
|---|---|---|---|---|---|---|---|---|---|---|---|---|---|---|---|
| 1 | feeder.ecngs.de | 5.39TB | 99.97 | 536037.46 | 8063934 | 96.01 | 97.52 | 717.91 | 8345370 | 0 | 0 | 0 | 53716 | 0 | |
| 2 | feeder2.ecngs.de | 1.53GB | 0.03 | 149.49 | 205160 | 89.63 | 2.48 | 7.84 | 228724 | 0 | 0 | 0 | 183 | 0 | |
| Total | 5.39TB | 100.00 | 536186.95 | 8269094 | 0.00 | 100.00 | 700.30 | 8574094 | 0 | 0 | 0 | 53899 | 0 | ||
 |
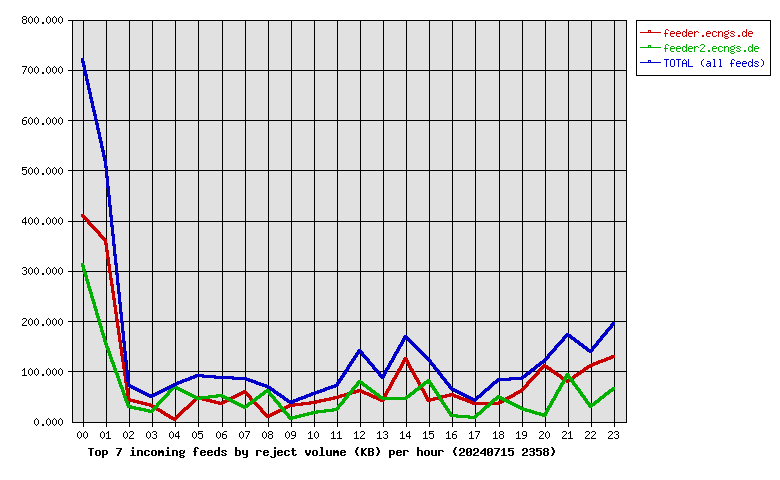
| Incoming Feed (+ Top1000 #) | Rej. Vol. | %Vol | Kbps | Accepted | %Acc | %Tot | KB/art | Check | Ihave | Spam | TooOld | Rejs | Errs | ||
|---|---|---|---|---|---|---|---|---|---|---|---|---|---|---|---|
| 1 | feeder.ecngs.de | 1.94MB | 59.47 | 0.18 | 8063934 | 96.01 | 97.52 | 717.91 | 8345370 | 0 | 0 | 0 | 53716 | 0 | |
| 2 | feeder2.ecngs.de | 1.32MB | 40.53 | 0.13 | 205160 | 89.63 | 2.48 | 7.84 | 228724 | 0 | 0 | 0 | 183 | 0 | |
| Total | 3.26MB | 100.00 | 0.31 | 8269094 | 0.00 | 100.00 | 700.30 | 8574094 | 0 | 0 | 0 | 53899 | 0 | ||
 |
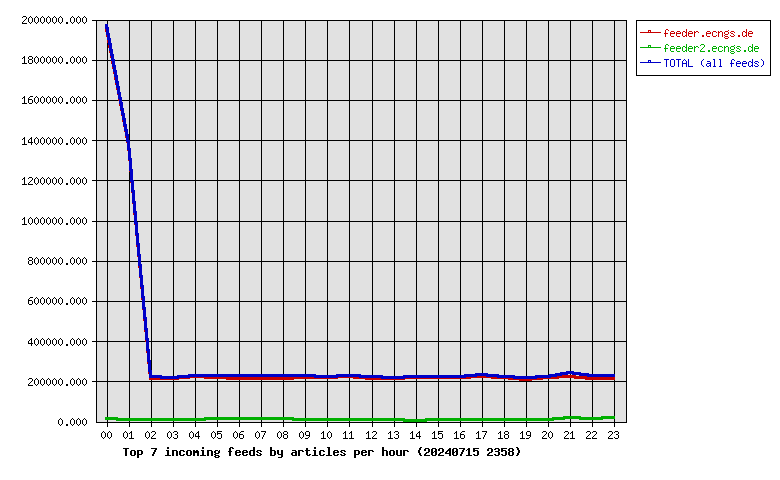
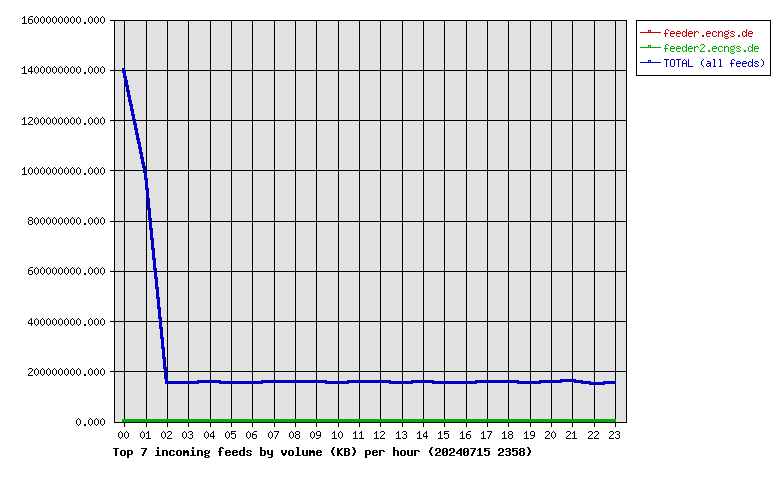
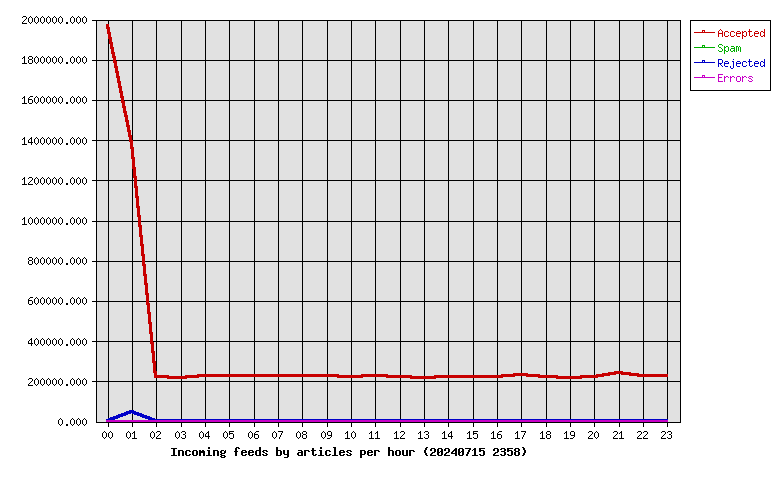
| Hour | Accepted | %Acc | Volume | %Vol | Check | Ihave | Spam | Rejs | Errs |
|---|---|---|---|---|---|---|---|---|---|
| 00 | 1966282 | 23.78 | 1.30TB | 24.19 | 1989072 | 0 | 0 | 4180 | 0 |
| 01 | 1381382 | 16.71 | 937.36GB | 16.97 | 1442034 | 0 | 0 | 49454 | 0 |
| 02 | 219197 | 2.65 | 147.10GB | 2.66 | 226060 | 0 | 0 | 9 | 0 |
| 03 | 218475 | 2.64 | 146.55GB | 2.65 | 224851 | 0 | 0 | 11 | 0 |
| 04 | 225332 | 2.72 | 148.92GB | 2.70 | 231940 | 0 | 0 | 9 | 0 |
| 05 | 226426 | 2.74 | 145.28GB | 2.63 | 245164 | 0 | 0 | 8 | 0 |
| 06 | 223934 | 2.71 | 145.53GB | 2.64 | 235764 | 0 | 0 | 16 | 0 |
| 07 | 225323 | 2.72 | 148.72GB | 2.69 | 238920 | 0 | 0 | 7 | 0 |
| 08 | 226087 | 2.73 | 149.05GB | 2.70 | 240623 | 0 | 0 | 10 | 0 |
| 09 | 224683 | 2.72 | 148.39GB | 2.69 | 232242 | 0 | 0 | 3 | 0 |
| 10 | 223690 | 2.71 | 146.49GB | 2.65 | 230886 | 0 | 0 | 8 | 0 |
| 11 | 225586 | 2.73 | 149.50GB | 2.71 | 233001 | 0 | 0 | 9 | 0 |
| 12 | 220208 | 2.66 | 149.19GB | 2.70 | 228874 | 0 | 0 | 16 | 0 |
| 13 | 215011 | 2.60 | 146.37GB | 2.65 | 220742 | 0 | 0 | 9 | 0 |
| 14 | 219087 | 2.65 | 149.69GB | 2.71 | 224363 | 0 | 0 | 14 | 0 |
| 15 | 222680 | 2.69 | 146.98GB | 2.66 | 228824 | 0 | 0 | 8 | 0 |
| 16 | 222738 | 2.69 | 146.71GB | 2.66 | 228681 | 0 | 0 | 9 | 0 |
| 17 | 228890 | 2.77 | 148.89GB | 2.70 | 238414 | 0 | 0 | 6 | 0 |
| 18 | 223842 | 2.71 | 148.81GB | 2.69 | 233951 | 0 | 0 | 19 | 0 |
| 19 | 215889 | 2.61 | 144.91GB | 2.62 | 224265 | 0 | 0 | 12 | 0 |
| 20 | 221790 | 2.68 | 149.34GB | 2.70 | 229643 | 0 | 0 | 17 | 0 |
| 21 | 239373 | 2.89 | 153.82GB | 2.79 | 258136 | 0 | 0 | 30 | 0 |
| 22 | 224878 | 2.72 | 143.96GB | 2.61 | 240105 | 0 | 0 | 15 | 0 |
| 23 | 228311 | 2.76 | 144.94GB | 2.62 | 247539 | 0 | 0 | 20 | 0 |
| Total | 8269094 | 100.00 | 5.39TB | 100.00 | 8574094 | 0 | 0 | 53899 | 0 |
 |
| Outgoing Feed (+ Top1000 #) | Accepted | %Acc | %Tot | Art/sec | Volume | %Vol | KB/art | Dups | Rejs | % Ratio (Out/In) | ||
|---|---|---|---|---|---|---|---|---|---|---|---|---|
| 1 | 217.73.144.40 | 0 | 0.00 | 0.00 | 0.00 | 0.00KB | 0.00 | 0.00 | 19024099 | 0 | … | |
| Total | 0 | 0.00 | 0.00 | 0.00 | 0.00KB | 0.00 | 0.00 | 19024099 | 0 | |||
 |
| Outgoing Feed (+ Top1000 #) | Volume | %Vol | Kbps | Accepted | %Acc | %Tot | KB/art | Dups | Rejs | % Ratio (Out/In) | ||
|---|---|---|---|---|---|---|---|---|---|---|---|---|
| 1 | 217.73.144.40 | 0.00KB | 0.00 | 0.00 | 0 | 0.00 | 0.00 | 0.00 | 19024099 | 0 | … | |
| Total | 0.00KB | 0.00 | 0.00 | 0 | 0.00 | 0.00 | 0.00 | 19024099 | 0 | |||
 |
| Outgoing Feed (+ Top1000 #) | Rej. Vol. | %Vol | Kbps | Accepted | %Acc | %Tot | KB/art | Dups | Rejs | % Ratio (Out/In) | ||
|---|---|---|---|---|---|---|---|---|---|---|---|---|
| 1 | 217.73.144.40 | 0.00KB | 0.00 | 0.00 | 0 | 0.00 | 0.00 | 0.00 | 19024099 | 0 | … | |
| Total | 0.00KB | 0.00 | 0.00 | 0 | 0.00 | 0.00 | 0.00 | 19024099 | 0 | |||
 |
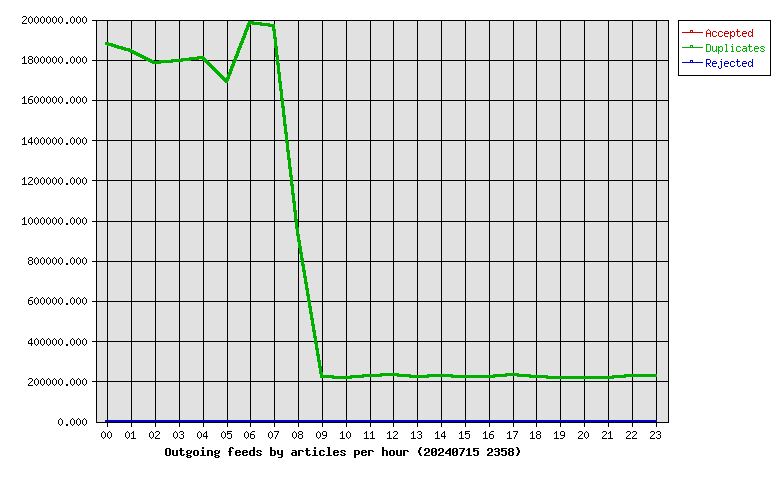
| Hour | Accepted | %Acc | Volume | %Vol | dups | Rejs |
|---|---|---|---|---|---|---|
| 00 | 0 | 0.00 | 0.00KB | 0.00 | 1876222 | 0 |
| 01 | 0 | 0.00 | 0.00KB | 0.00 | 1843355 | 0 |
| 02 | 0 | 0.00 | 0.00KB | 0.00 | 1783784 | 0 |
| 03 | 0 | 0.00 | 0.00KB | 0.00 | 1793167 | 0 |
| 04 | 0 | 0.00 | 0.00KB | 0.00 | 1809973 | 0 |
| 05 | 0 | 0.00 | 0.00KB | 0.00 | 1687583 | 0 |
| 06 | 0 | 0.00 | 0.00KB | 0.00 | 1982983 | 0 |
| 07 | 0 | 0.00 | 0.00KB | 0.00 | 1968943 | 0 |
| 08 | 0 | 0.00 | 0.00KB | 0.00 | 938048 | 0 |
| 09 | 0 | 0.00 | 0.00KB | 0.00 | 219937 | 0 |
| 10 | 0 | 0.00 | 0.00KB | 0.00 | 216246 | 0 |
| 11 | 0 | 0.00 | 0.00KB | 0.00 | 225196 | 0 |
| 12 | 0 | 0.00 | 0.00KB | 0.00 | 230323 | 0 |
| 13 | 0 | 0.00 | 0.00KB | 0.00 | 223042 | 0 |
| 14 | 0 | 0.00 | 0.00KB | 0.00 | 227550 | 0 |
| 15 | 0 | 0.00 | 0.00KB | 0.00 | 222841 | 0 |
| 16 | 0 | 0.00 | 0.00KB | 0.00 | 223699 | 0 |
| 17 | 0 | 0.00 | 0.00KB | 0.00 | 229239 | 0 |
| 18 | 0 | 0.00 | 0.00KB | 0.00 | 220021 | 0 |
| 19 | 0 | 0.00 | 0.00KB | 0.00 | 217144 | 0 |
| 20 | 0 | 0.00 | 0.00KB | 0.00 | 217455 | 0 |
| 21 | 0 | 0.00 | 0.00KB | 0.00 | 218736 | 0 |
| 22 | 0 | 0.00 | 0.00KB | 0.00 | 223942 | 0 |
| 23 | 0 | 0.00 | 0.00KB | 0.00 | 224670 | 0 |
| Total | 0 | 0.00 | 0.00KB | 0.00 | 19024099 | 0 |
 |
| >= 20% Full | >= 35% Full | >= 50% Full | >= 65% Full | >= 80% Full | >= 95% Full |
| Outgoing Feed | Batch Seq | Batch Num | Batch Max | %Full | Av. Pending |
|---|---|---|---|---|---|
| nbr.elbracht.net-o | 969343-969424 | 81 | 500 | 16 | 0.0 |
| text-spool-out | 0-0 | 0 | 500 | 0 | 0.0 |
| 1st Time | Last Time | # Msgs | Message |
|---|