| |
DIABLO statistics for newsfeed.yoursite.com on Sun 14 Jul 2024 |
Generated on 20240714 2358 by feeder-stats v4.006. Copyright © 2002 The Diablo Project.
Diablo running processes:  86    Dnewslink running processes:  1


12:00AM  up 147 days,  7:19, 0 users, load averages: 7.43, 6.41, 6.03

Filesystem     Size    Used   Avail Capacity  Mounted on
/dev/da0s1g     94G    2.0G     84G     2%    /news
/dev/da1       7.3T    6.6T     61G    99%    /news2/spool/news/00
/dev/da2       7.3T    6.6T     61G    99%    /news2/spool/news/01
/dev/da3       3.7T    3.3T     85G    98%    /news2/spool/news/02
/dev/da4       5.5T      5T     70G    99%    /news2/spool/news/03
/dev/da8       7.3T    6.6T     61G    99%    /news2/spool/news/04
/dev/da9       7.3T    6.6T     61G    99%    /news2/spool/news/05
/dev/da10      7.3T    6.6T     57G    99%    /news2/spool/news/06
/dev/da11      5.5T      5T     45G    99%    /news2/spool/news/07
/dev/da12      5.5T      5T     46G    99%    /news2/spool/news/08
/dev/da13      7.3T    6.7T     57G    99%    /news2/spool/news/09
/dev/da14      7.3T    6.6T     58G    99%    /news2/spool/news/10
/dev/da15      7.3T    6.6T     58G    99%    /news2/spool/news/11
/dev/da16      7.3T    6.6T     57G    99%    /news2/spool/news/12
/dev/da17      7.3T    6.6T     60G    99%    /news2/spool/news/13
/dev/da18      7.3T    6.6T     59G    99%    /news2/spool/news/14
/dev/da19      7.3T    6.6T     57G    99%    /news2/spool/news/15
/dev/da20      7.3T    6.7T     56G    99%    /news2/spool/news/16
/dev/da21      7.3T    6.6T     58G    99%    /news2/spool/news/17
/dev/da22      7.3T    6.6T     57G    99%    /news2/spool/news/18
/dev/da23      7.3T    6.7T     55G    99%    /news2/spool/news/19
/dev/da24      7.3T    6.6T     62G    99%    /news2/spool/news/20
/dev/da25      7.3T    6.6T     59G    99%    /news2/spool/news/21
/dev/da26      7.3T    6.6T     58G    99%    /news2/spool/news/22
/dev/da5       221G     36G    167G    18%    /news1
/dev/md0        40G     15G     20G    42%    /news3
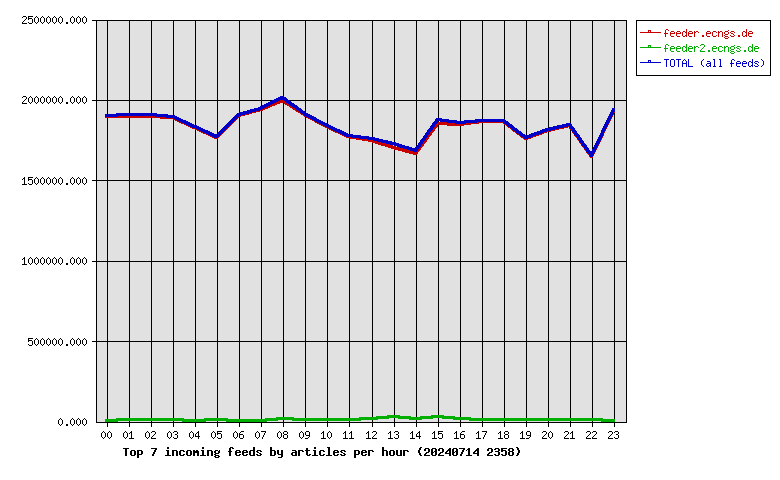
| Incoming Feed (+ Top1000 #) | Accepted | %Acc | %Tot | Art/sec | Volume | %Vol | KB/art | Check | Ihave | Spam | TooOld | Rejs | Errs | ||
|---|---|---|---|---|---|---|---|---|---|---|---|---|---|---|---|
| 1 | feeder.ecngs.de | 43992141 | 92.10 | 99.44 | 509.17 | 29.58TB | 99.99 | 722.03 | 46074816 | 0 | 0 | 0 | 1693357 | 0 | |
| 2 | feeder2.ecngs.de | 246340 | 73.10 | 0.56 | 2.85 | 1.65GB | 0.01 | 7.02 | 335278 | 0 | 0 | 0 | 1721 | 0 | |
| Total | 44238481 | 0.00 | 100.00 | 512.02 | 29.58TB | 100.00 | 718.05 | 46410094 | 0 | 0 | 0 | 1695078 | 0 | ||
 |
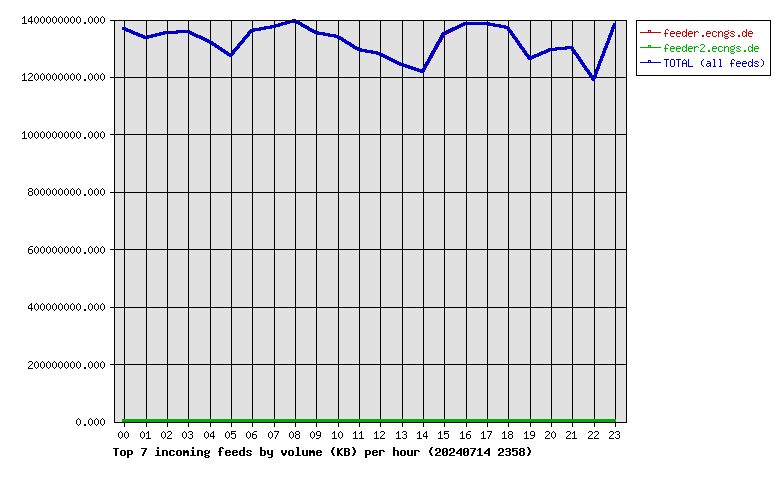
| Incoming Feed (+ Top1000 #) | Volume | %Vol | Kbps | Accepted | %Acc | %Tot | KB/art | Check | Ihave | Spam | TooOld | Rejs | Errs | ||
|---|---|---|---|---|---|---|---|---|---|---|---|---|---|---|---|
| 1 | feeder.ecngs.de | 29.58TB | 99.99 | 2941068.47 | 43992141 | 92.10 | 99.44 | 722.03 | 46074816 | 0 | 0 | 0 | 1693357 | 0 | |
| 2 | feeder2.ecngs.de | 1.65GB | 0.01 | 160.22 | 246340 | 73.10 | 0.56 | 7.02 | 335278 | 0 | 0 | 0 | 1721 | 0 | |
| Total | 29.58TB | 100.00 | 2941228.69 | 44238481 | 0.00 | 100.00 | 718.05 | 46410094 | 0 | 0 | 0 | 1695078 | 0 | ||
 |
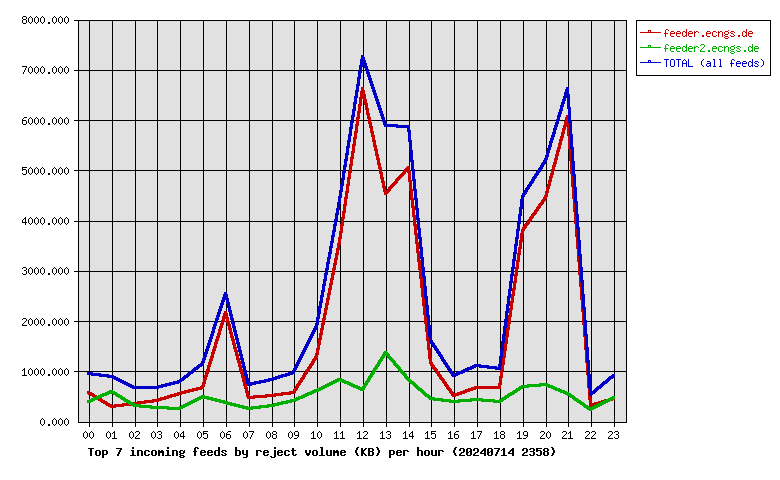
| Incoming Feed (+ Top1000 #) | Rej. Vol. | %Vol | Kbps | Accepted | %Acc | %Tot | KB/art | Check | Ihave | Spam | TooOld | Rejs | Errs | ||
|---|---|---|---|---|---|---|---|---|---|---|---|---|---|---|---|
| 1 | feeder.ecngs.de | 44.53MB | 78.90 | 4.22 | 43992141 | 92.10 | 99.44 | 722.03 | 46074816 | 0 | 0 | 0 | 1693357 | 0 | |
| 2 | feeder2.ecngs.de | 11.91MB | 21.10 | 1.13 | 246340 | 73.10 | 0.56 | 7.02 | 335278 | 0 | 0 | 0 | 1721 | 0 | |
| Total | 56.43MB | 100.00 | 5.35 | 44238481 | 0.00 | 100.00 | 718.05 | 46410094 | 0 | 0 | 0 | 1695078 | 0 | ||
 |
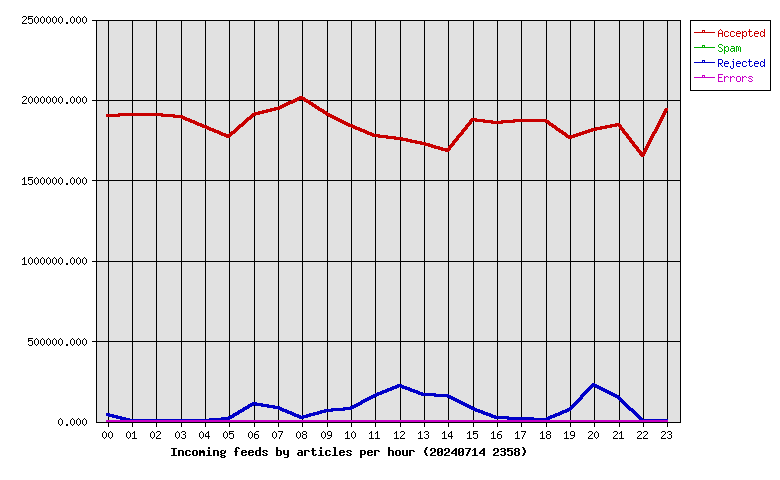
| Hour | Accepted | %Acc | Volume | %Vol | Check | Ihave | Spam | Rejs | Errs |
|---|---|---|---|---|---|---|---|---|---|
| 00 | 1900368 | 4.30 | 1.27TB | 4.30 | 1951923 | 0 | 0 | 41252 | 0 |
| 01 | 1908683 | 4.31 | 1.24TB | 4.20 | 1928558 | 0 | 0 | 105 | 0 |
| 02 | 1906026 | 4.31 | 1.26TB | 4.25 | 1922752 | 0 | 0 | 97 | 0 |
| 03 | 1894910 | 4.28 | 1.26TB | 4.27 | 1904666 | 0 | 0 | 84 | 0 |
| 04 | 1829720 | 4.14 | 1.23TB | 4.16 | 1837264 | 0 | 0 | 62 | 0 |
| 05 | 1767452 | 4.00 | 1.18TB | 4.00 | 1847520 | 0 | 0 | 15414 | 0 |
| 06 | 1904415 | 4.30 | 1.27TB | 4.28 | 2022543 | 0 | 0 | 108965 | 0 |
| 07 | 1942589 | 4.39 | 1.28TB | 4.32 | 2032901 | 0 | 0 | 82923 | 0 |
| 08 | 2008939 | 4.54 | 1.30TB | 4.40 | 2054313 | 0 | 0 | 23426 | 0 |
| 09 | 1912201 | 4.32 | 1.26TB | 4.26 | 1988104 | 0 | 0 | 64972 | 0 |
| 10 | 1837481 | 4.15 | 1.25TB | 4.21 | 1930069 | 0 | 0 | 79044 | 0 |
| 11 | 1777073 | 4.02 | 1.20TB | 4.07 | 1955727 | 0 | 0 | 161637 | 0 |
| 12 | 1758557 | 3.98 | 1.19TB | 4.03 | 2005513 | 0 | 0 | 223216 | 0 |
| 13 | 1728520 | 3.91 | 1.16TB | 3.91 | 1944360 | 0 | 0 | 163685 | 0 |
| 14 | 1681179 | 3.80 | 1.13TB | 3.83 | 1875017 | 0 | 0 | 160794 | 0 |
| 15 | 1875223 | 4.24 | 1.26TB | 4.24 | 1994627 | 0 | 0 | 75656 | 0 |
| 16 | 1858617 | 4.20 | 1.29TB | 4.36 | 1902812 | 0 | 0 | 21680 | 0 |
| 17 | 1869920 | 4.23 | 1.29TB | 4.35 | 1897840 | 0 | 0 | 14814 | 0 |
| 18 | 1867787 | 4.22 | 1.28TB | 4.32 | 1888242 | 0 | 0 | 9784 | 0 |
| 19 | 1763306 | 3.99 | 1.17TB | 3.97 | 1849090 | 0 | 0 | 73166 | 0 |
| 20 | 1812494 | 4.10 | 1.20TB | 4.07 | 2052007 | 0 | 0 | 226959 | 0 |
| 21 | 1845008 | 4.17 | 1.21TB | 4.10 | 2018173 | 0 | 0 | 147189 | 0 |
| 22 | 1651160 | 3.73 | 1.11TB | 3.75 | 1662125 | 0 | 0 | 61 | 0 |
| 23 | 1936853 | 4.38 | 1.29TB | 4.35 | 1943948 | 0 | 0 | 93 | 0 |
| Total | 44238481 | 100.00 | 29.58TB | 100.00 | 46410094 | 0 | 0 | 1695078 | 0 |
 |
| Outgoing Feed (+ Top1000 #) | Accepted | %Acc | %Tot | Art/sec | Volume | %Vol | KB/art | Dups | Rejs | % Ratio (Out/In) | ||
|---|---|---|---|---|---|---|---|---|---|---|---|---|
| 1 | 217.73.144.40 | 0 | 0.00 | 0.00 | 0.00 | 0.00KB | 0.00 | 0.00 | 44121827 | 0 | … | |
| Total | 0 | 0.00 | 0.00 | 0.00 | 0.00KB | 0.00 | 0.00 | 44121827 | 0 | |||
 |
| Outgoing Feed (+ Top1000 #) | Volume | %Vol | Kbps | Accepted | %Acc | %Tot | KB/art | Dups | Rejs | % Ratio (Out/In) | ||
|---|---|---|---|---|---|---|---|---|---|---|---|---|
| 1 | 217.73.144.40 | 0.00KB | 0.00 | 0.00 | 0 | 0.00 | 0.00 | 0.00 | 44121827 | 0 | … | |
| Total | 0.00KB | 0.00 | 0.00 | 0 | 0.00 | 0.00 | 0.00 | 44121827 | 0 | |||
 |
| Outgoing Feed (+ Top1000 #) | Rej. Vol. | %Vol | Kbps | Accepted | %Acc | %Tot | KB/art | Dups | Rejs | % Ratio (Out/In) | ||
|---|---|---|---|---|---|---|---|---|---|---|---|---|
| 1 | 217.73.144.40 | 0.00KB | 0.00 | 0.00 | 0 | 0.00 | 0.00 | 0.00 | 44121827 | 0 | … | |
| Total | 0.00KB | 0.00 | 0.00 | 0 | 0.00 | 0.00 | 0.00 | 44121827 | 0 | |||
 |
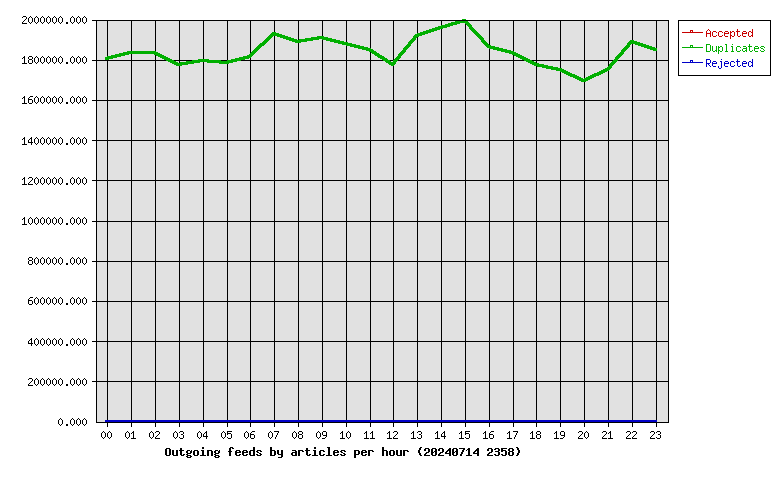
| Hour | Accepted | %Acc | Volume | %Vol | dups | Rejs |
|---|---|---|---|---|---|---|
| 00 | 0 | 0.00 | 0.00KB | 0.00 | 1805647 | 0 |
| 01 | 0 | 0.00 | 0.00KB | 0.00 | 1831347 | 0 |
| 02 | 0 | 0.00 | 0.00KB | 0.00 | 1832709 | 0 |
| 03 | 0 | 0.00 | 0.00KB | 0.00 | 1771949 | 0 |
| 04 | 0 | 0.00 | 0.00KB | 0.00 | 1791943 | 0 |
| 05 | 0 | 0.00 | 0.00KB | 0.00 | 1785267 | 0 |
| 06 | 0 | 0.00 | 0.00KB | 0.00 | 1811049 | 0 |
| 07 | 0 | 0.00 | 0.00KB | 0.00 | 1927992 | 0 |
| 08 | 0 | 0.00 | 0.00KB | 0.00 | 1885729 | 0 |
| 09 | 0 | 0.00 | 0.00KB | 0.00 | 1910259 | 0 |
| 10 | 0 | 0.00 | 0.00KB | 0.00 | 1879508 | 0 |
| 11 | 0 | 0.00 | 0.00KB | 0.00 | 1848456 | 0 |
| 12 | 0 | 0.00 | 0.00KB | 0.00 | 1772198 | 0 |
| 13 | 0 | 0.00 | 0.00KB | 0.00 | 1916108 | 0 |
| 14 | 0 | 0.00 | 0.00KB | 0.00 | 1959666 | 0 |
| 15 | 0 | 0.00 | 0.00KB | 0.00 | 1991241 | 0 |
| 16 | 0 | 0.00 | 0.00KB | 0.00 | 1865035 | 0 |
| 17 | 0 | 0.00 | 0.00KB | 0.00 | 1834435 | 0 |
| 18 | 0 | 0.00 | 0.00KB | 0.00 | 1774603 | 0 |
| 19 | 0 | 0.00 | 0.00KB | 0.00 | 1748364 | 0 |
| 20 | 0 | 0.00 | 0.00KB | 0.00 | 1693270 | 0 |
| 21 | 0 | 0.00 | 0.00KB | 0.00 | 1748093 | 0 |
| 22 | 0 | 0.00 | 0.00KB | 0.00 | 1888596 | 0 |
| 23 | 0 | 0.00 | 0.00KB | 0.00 | 1848363 | 0 |
| Total | 0 | 0.00 | 0.00KB | 0.00 | 44121827 | 0 |
 |
| >= 20% Full | >= 35% Full | >= 50% Full | >= 65% Full | >= 80% Full | >= 95% Full |
| Outgoing Feed | Batch Seq | Batch Num | Batch Max | %Full | Av. Pending |
|---|---|---|---|---|---|
| nbr.elbracht.net-o | 969056-969137 | 81 | 500 | 16 | 0.0 |
| text-spool-out | 0-0 | 0 | 500 | 0 | 0.0 |
| 1st Time | Last Time | # Msgs | Message |
|---|---|---|---|
| 19:56:31 | 23:08:42 | 6 | DNS Fwd/Rev mismatch: lookup of unused-space.coop.net failed |
| 13:08:09 | 1 | DNS Fwd/Rev mismatch: internettl.org/104.152.52.213 | |
| 13:08:33 | 1 | DNS Fwd/Rev mismatch: internettl.org/104.152.52.201 |