| |
DIABLO statistics for newsfeed.yoursite.com on Fri 12 Jul 2024 |
Generated on 20240712 2358 by feeder-stats v4.006. Copyright © 2002 The Diablo Project.
Diablo running processes:  90    Dnewslink running processes:  0


12:00AM  up 145 days,  7:19, 0 users, load averages: 12.92, 12.00, 11.53

Filesystem     Size    Used   Avail Capacity  Mounted on
/dev/da0s1g     94G      2G     84G     2%    /news
/dev/da1       7.3T    6.6T     83G    99%    /news2/spool/news/00
/dev/da2       7.3T    6.6T     87G    99%    /news2/spool/news/01
/dev/da3       3.7T    3.3T     48G    99%    /news2/spool/news/02
/dev/da4       5.5T      5T     66G    99%    /news2/spool/news/03
/dev/da8       7.3T    6.6T     85G    99%    /news2/spool/news/04
/dev/da9       7.3T    6.6T     87G    99%    /news2/spool/news/05
/dev/da10      7.3T    6.6T     78G    99%    /news2/spool/news/06
/dev/da11      5.5T      5T     63G    99%    /news2/spool/news/07
/dev/da12      5.5T      5T     61G    99%    /news2/spool/news/08
/dev/da13      7.3T    6.6T     83G    99%    /news2/spool/news/09
/dev/da14      7.3T    6.6T     85G    99%    /news2/spool/news/10
/dev/da15      7.3T    6.6T     82G    99%    /news2/spool/news/11
/dev/da16      7.3T    6.6T     81G    99%    /news2/spool/news/12
/dev/da17      7.3T    6.6T     82G    99%    /news2/spool/news/13
/dev/da18      7.3T    6.6T     83G    99%    /news2/spool/news/14
/dev/da19      7.3T    6.6T     84G    99%    /news2/spool/news/15
/dev/da20      7.3T    6.6T     74G    99%    /news2/spool/news/16
/dev/da21      7.3T    6.6T     85G    99%    /news2/spool/news/17
/dev/da22      7.3T    6.6T     80G    99%    /news2/spool/news/18
/dev/da23      7.3T    6.6T     80G    99%    /news2/spool/news/19
/dev/da24      7.3T    6.6T     82G    99%    /news2/spool/news/20
/dev/da25      7.3T    6.6T     79G    99%    /news2/spool/news/21
/dev/da26      7.3T    6.6T     82G    99%    /news2/spool/news/22
/dev/da5       221G     36G    167G    18%    /news1
/dev/md0        40G     15G     20G    43%    /news3
| Incoming Feed (+ Top1000 #) | Accepted | %Acc | %Tot | Art/sec | Volume | %Vol | KB/art | Check | Ihave | Spam | TooOld | Rejs | Errs | ||
|---|---|---|---|---|---|---|---|---|---|---|---|---|---|---|---|
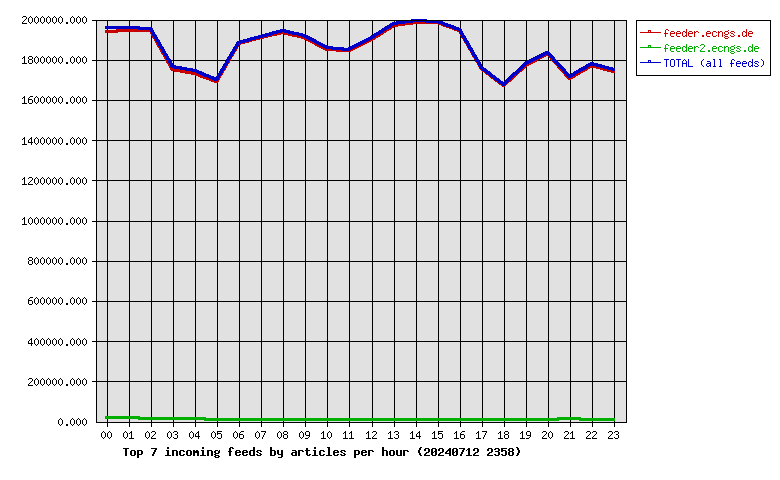
| 1 | feeder.ecngs.de | 44314798 | 88.61 | 99.50 | 512.90 | 29.75TB | 99.99 | 720.92 | 47367667 | 0 | 0 | 0 | 2643721 | 0 | |
| 2 | feeder2.ecngs.de | 220996 | 74.73 | 0.50 | 2.57 | 1.93GB | 0.01 | 9.15 | 294297 | 0 | 0 | 0 | 1419 | 0 | |
| Total | 44535794 | 0.00 | 100.00 | 515.47 | 29.76TB | 100.00 | 717.39 | 47661964 | 0 | 0 | 0 | 2645140 | 0 | ||
 |
| Incoming Feed (+ Top1000 #) | Volume | %Vol | Kbps | Accepted | %Acc | %Tot | KB/art | Check | Ihave | Spam | TooOld | Rejs | Errs | ||
|---|---|---|---|---|---|---|---|---|---|---|---|---|---|---|---|
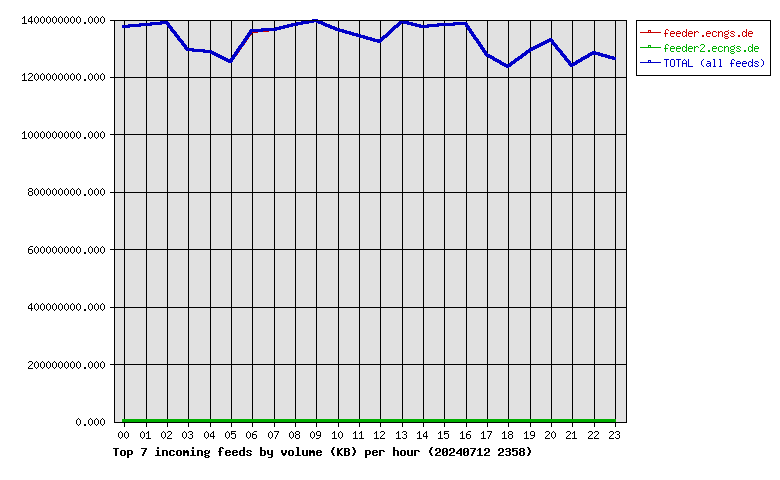
| 1 | feeder.ecngs.de | 29.75TB | 99.99 | 2958101.55 | 44314798 | 88.61 | 99.50 | 720.92 | 47367667 | 0 | 0 | 0 | 2643721 | 0 | |
| 2 | feeder2.ecngs.de | 1.93GB | 0.01 | 187.88 | 220996 | 74.73 | 0.50 | 9.15 | 294297 | 0 | 0 | 0 | 1419 | 0 | |
| Total | 29.76TB | 100.00 | 2958289.43 | 44535794 | 0.00 | 100.00 | 717.39 | 47661964 | 0 | 0 | 0 | 2645140 | 0 | ||
 |
| Incoming Feed (+ Top1000 #) | Rej. Vol. | %Vol | Kbps | Accepted | %Acc | %Tot | KB/art | Check | Ihave | Spam | TooOld | Rejs | Errs | ||
|---|---|---|---|---|---|---|---|---|---|---|---|---|---|---|---|
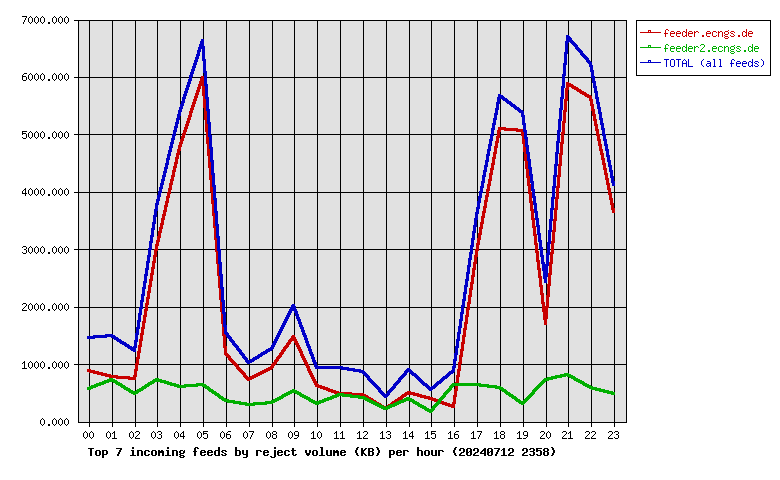
| 1 | feeder.ecngs.de | 52.12MB | 81.72 | 4.94 | 44314798 | 88.61 | 99.50 | 720.92 | 47367667 | 0 | 0 | 0 | 2643721 | 0 | |
| 2 | feeder2.ecngs.de | 11.66MB | 18.28 | 1.11 | 220996 | 74.73 | 0.50 | 9.15 | 294297 | 0 | 0 | 0 | 1419 | 0 | |
| Total | 63.78MB | 100.00 | 6.05 | 44535794 | 0.00 | 100.00 | 717.39 | 47661964 | 0 | 0 | 0 | 2645140 | 0 | ||
 |
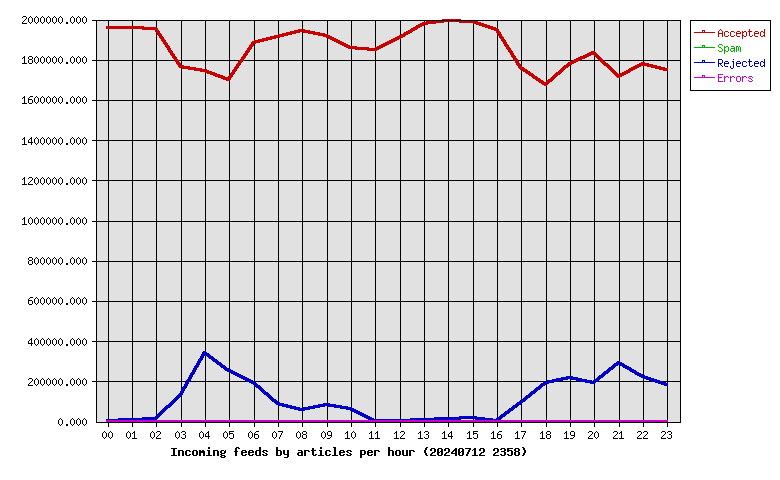
| Hour | Accepted | %Acc | Volume | %Vol | Check | Ihave | Spam | Rejs | Errs |
|---|---|---|---|---|---|---|---|---|---|
| 00 | 1957570 | 4.40 | 1.28TB | 4.30 | 1989272 | 0 | 0 | 1550 | 0 |
| 01 | 1959335 | 4.40 | 1.29TB | 4.33 | 1994782 | 0 | 0 | 9923 | 0 |
| 02 | 1952056 | 4.38 | 1.29TB | 4.34 | 1983334 | 0 | 0 | 11093 | 0 |
| 03 | 1762885 | 3.96 | 1.21TB | 4.05 | 1920345 | 0 | 0 | 133355 | 0 |
| 04 | 1741377 | 3.91 | 1.20TB | 4.03 | 2100224 | 0 | 0 | 339588 | 0 |
| 05 | 1698466 | 3.81 | 1.16TB | 3.91 | 2065097 | 0 | 0 | 251289 | 0 |
| 06 | 1884924 | 4.23 | 1.26TB | 4.25 | 2082891 | 0 | 0 | 189145 | 0 |
| 07 | 1914315 | 4.30 | 1.27TB | 4.26 | 2008976 | 0 | 0 | 86248 | 0 |
| 08 | 1942822 | 4.36 | 1.29TB | 4.33 | 2011901 | 0 | 0 | 56664 | 0 |
| 09 | 1917830 | 4.31 | 1.30TB | 4.37 | 2011346 | 0 | 0 | 80348 | 0 |
| 10 | 1856159 | 4.17 | 1.27TB | 4.27 | 1930664 | 0 | 0 | 61401 | 0 |
| 11 | 1850397 | 4.15 | 1.25TB | 4.21 | 1863476 | 0 | 0 | 1529 | 0 |
| 12 | 1905715 | 4.28 | 1.23TB | 4.13 | 1920244 | 0 | 0 | 508 | 0 |
| 13 | 1975149 | 4.43 | 1.30TB | 4.36 | 1992280 | 0 | 0 | 8514 | 0 |
| 14 | 1992846 | 4.47 | 1.28TB | 4.30 | 2018867 | 0 | 0 | 12691 | 0 |
| 15 | 1988205 | 4.46 | 1.29TB | 4.33 | 2012970 | 0 | 0 | 15643 | 0 |
| 16 | 1949681 | 4.38 | 1.29TB | 4.33 | 1964406 | 0 | 0 | 3903 | 0 |
| 17 | 1757700 | 3.95 | 1.19TB | 4.00 | 1862328 | 0 | 0 | 94290 | 0 |
| 18 | 1673459 | 3.76 | 1.15TB | 3.86 | 1873665 | 0 | 0 | 189697 | 0 |
| 19 | 1780326 | 4.00 | 1.20TB | 4.03 | 2028914 | 0 | 0 | 214502 | 0 |
| 20 | 1835030 | 4.12 | 1.24TB | 4.16 | 2039305 | 0 | 0 | 189585 | 0 |
| 21 | 1712971 | 3.85 | 1.15TB | 3.88 | 2027174 | 0 | 0 | 292951 | 0 |
| 22 | 1777706 | 3.99 | 1.20TB | 4.02 | 2014218 | 0 | 0 | 220339 | 0 |
| 23 | 1748870 | 3.93 | 1.18TB | 3.95 | 1945285 | 0 | 0 | 180384 | 0 |
| Total | 44535794 | 100.00 | 29.76TB | 100.00 | 47661964 | 0 | 0 | 2645140 | 0 |
 |
| Outgoing Feed (+ Top1000 #) | Accepted | %Acc | %Tot | Art/sec | Volume | %Vol | KB/art | Dups | Rejs | % Ratio (Out/In) | ||
|---|---|---|---|---|---|---|---|---|---|---|---|---|
| 1 | 217.73.144.40 | 0 | 0.00 | 0.00 | 0.00 | 0.00KB | 0.00 | 0.00 | 45579509 | 0 | … | |
| Total | 0 | 0.00 | 0.00 | 0.00 | 0.00KB | 0.00 | 0.00 | 45579509 | 0 | |||
 |
| Outgoing Feed (+ Top1000 #) | Volume | %Vol | Kbps | Accepted | %Acc | %Tot | KB/art | Dups | Rejs | % Ratio (Out/In) | ||
|---|---|---|---|---|---|---|---|---|---|---|---|---|
| 1 | 217.73.144.40 | 0.00KB | 0.00 | 0.00 | 0 | 0.00 | 0.00 | 0.00 | 45579509 | 0 | … | |
| Total | 0.00KB | 0.00 | 0.00 | 0 | 0.00 | 0.00 | 0.00 | 45579509 | 0 | |||
 |
| Outgoing Feed (+ Top1000 #) | Rej. Vol. | %Vol | Kbps | Accepted | %Acc | %Tot | KB/art | Dups | Rejs | % Ratio (Out/In) | ||
|---|---|---|---|---|---|---|---|---|---|---|---|---|
| 1 | 217.73.144.40 | 0.00KB | 0.00 | 0.00 | 0 | 0.00 | 0.00 | 0.00 | 45579509 | 0 | … | |
| Total | 0.00KB | 0.00 | 0.00 | 0 | 0.00 | 0.00 | 0.00 | 45579509 | 0 | |||
 |
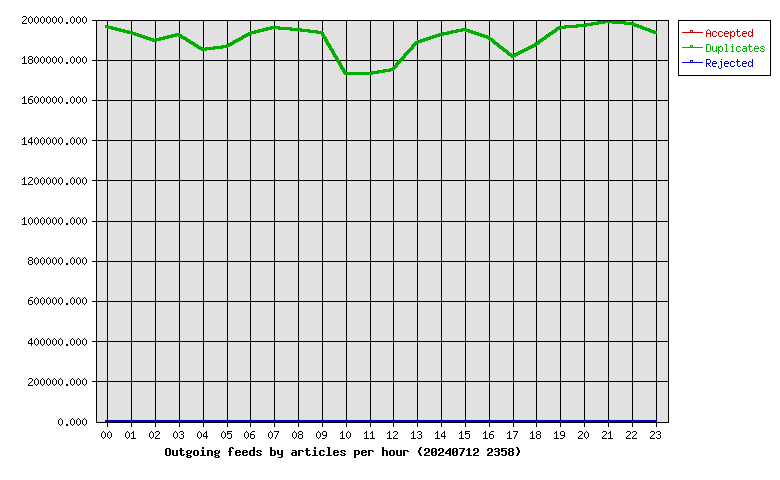
| Hour | Accepted | %Acc | Volume | %Vol | dups | Rejs |
|---|---|---|---|---|---|---|
| 00 | 0 | 0.00 | 0.00KB | 0.00 | 1963589 | 0 |
| 01 | 0 | 0.00 | 0.00KB | 0.00 | 1933284 | 0 |
| 02 | 0 | 0.00 | 0.00KB | 0.00 | 1891029 | 0 |
| 03 | 0 | 0.00 | 0.00KB | 0.00 | 1920683 | 0 |
| 04 | 0 | 0.00 | 0.00KB | 0.00 | 1848363 | 0 |
| 05 | 0 | 0.00 | 0.00KB | 0.00 | 1862905 | 0 |
| 06 | 0 | 0.00 | 0.00KB | 0.00 | 1929169 | 0 |
| 07 | 0 | 0.00 | 0.00KB | 0.00 | 1959962 | 0 |
| 08 | 0 | 0.00 | 0.00KB | 0.00 | 1948719 | 0 |
| 09 | 0 | 0.00 | 0.00KB | 0.00 | 1932959 | 0 |
| 10 | 0 | 0.00 | 0.00KB | 0.00 | 1727379 | 0 |
| 11 | 0 | 0.00 | 0.00KB | 0.00 | 1729405 | 0 |
| 12 | 0 | 0.00 | 0.00KB | 0.00 | 1750824 | 0 |
| 13 | 0 | 0.00 | 0.00KB | 0.00 | 1884786 | 0 |
| 14 | 0 | 0.00 | 0.00KB | 0.00 | 1924715 | 0 |
| 15 | 0 | 0.00 | 0.00KB | 0.00 | 1945480 | 0 |
| 16 | 0 | 0.00 | 0.00KB | 0.00 | 1910039 | 0 |
| 17 | 0 | 0.00 | 0.00KB | 0.00 | 1815510 | 0 |
| 18 | 0 | 0.00 | 0.00KB | 0.00 | 1873992 | 0 |
| 19 | 0 | 0.00 | 0.00KB | 0.00 | 1958382 | 0 |
| 20 | 0 | 0.00 | 0.00KB | 0.00 | 1968868 | 0 |
| 21 | 0 | 0.00 | 0.00KB | 0.00 | 1987154 | 0 |
| 22 | 0 | 0.00 | 0.00KB | 0.00 | 1977640 | 0 |
| 23 | 0 | 0.00 | 0.00KB | 0.00 | 1934673 | 0 |
| Total | 0 | 0.00 | 0.00KB | 0.00 | 45579509 | 0 |
 |
| >= 20% Full | >= 35% Full | >= 50% Full | >= 65% Full | >= 80% Full | >= 95% Full |
| Outgoing Feed | Batch Seq | Batch Num | Batch Max | %Full | Av. Pending |
|---|---|---|---|---|---|
| nbr.elbracht.net-o | 968480-968561 | 81 | 500 | 16 | 0.0 |
| text-spool-out | 0-0 | 0 | 500 | 0 | 0.0 |
| 1st Time | Last Time | # Msgs | Message |
|---|---|---|---|
| 16:17:54 | 1 | DNS Fwd/Rev mismatch: visit.keznews.com/194.165.16.72 |