| |
DIABLO statistics for newsfeed.yoursite.com on Thu 11 Jul 2024 |
Generated on 20240711 2358 by feeder-stats v4.006. Copyright © 2002 The Diablo Project.
Diablo running processes:  86    Dnewslink running processes:  0


12:00AM  up 144 days,  7:19, 0 users, load averages: 9.72, 8.55, 8.23

Filesystem     Size    Used   Avail Capacity  Mounted on
/dev/da0s1g     94G    2.1G     84G     2%    /news
/dev/da1       7.3T    6.7T     55G    99%    /news2/spool/news/00
/dev/da2       7.3T    6.6T     64G    99%    /news2/spool/news/01
/dev/da3       3.7T    3.3T     57G    98%    /news2/spool/news/02
/dev/da4       5.5T      5T     78G    98%    /news2/spool/news/03
/dev/da8       7.3T    6.6T     64G    99%    /news2/spool/news/04
/dev/da9       7.3T    6.6T     68G    99%    /news2/spool/news/05
/dev/da10      7.3T    6.7T     54G    99%    /news2/spool/news/06
/dev/da11      5.5T      5T     87G    98%    /news2/spool/news/07
/dev/da12      5.5T      5T     43G    99%    /news2/spool/news/08
/dev/da13      7.3T    6.6T     62G    99%    /news2/spool/news/09
/dev/da14      7.3T    6.6T     66G    99%    /news2/spool/news/10
/dev/da15      7.3T    6.6T     58G    99%    /news2/spool/news/11
/dev/da16      7.3T    6.6T     60G    99%    /news2/spool/news/12
/dev/da17      7.3T    6.7T     56G    99%    /news2/spool/news/13
/dev/da18      7.3T    6.6T     59G    99%    /news2/spool/news/14
/dev/da19      7.3T    6.6T     65G    99%    /news2/spool/news/15
/dev/da20      7.3T    6.7T     50G    99%    /news2/spool/news/16
/dev/da21      7.3T    6.6T     62G    99%    /news2/spool/news/17
/dev/da22      7.3T    6.6T     57G    99%    /news2/spool/news/18
/dev/da23      7.3T    6.6T     58G    99%    /news2/spool/news/19
/dev/da24      7.3T    6.6T     62G    99%    /news2/spool/news/20
/dev/da25      7.3T    6.7T     56G    99%    /news2/spool/news/21
/dev/da26      7.3T    6.6T     60G    99%    /news2/spool/news/22
/dev/da5       221G     36G    167G    18%    /news1
/dev/md0        40G     15G     20G    43%    /news3
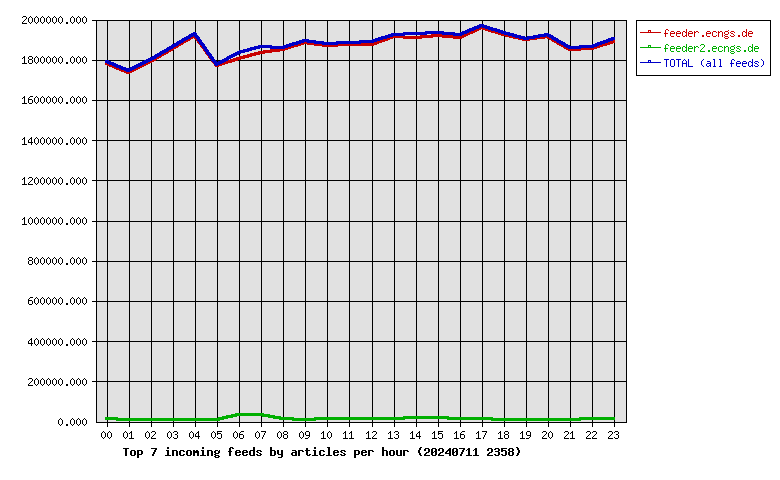
| Incoming Feed (+ Top1000 #) | Accepted | %Acc | %Tot | Art/sec | Volume | %Vol | KB/art | Check | Ihave | Spam | TooOld | Rejs | Errs | ||
|---|---|---|---|---|---|---|---|---|---|---|---|---|---|---|---|
| 1 | feeder.ecngs.de | 44740793 | 85.18 | 99.33 | 517.83 | 30.11TB | 99.99 | 722.62 | 48901563 | 0 | 0 | 0 | 3620879 | 0 | |
| 2 | feeder2.ecngs.de | 301319 | 74.34 | 0.67 | 3.49 | 2.57GB | 0.01 | 8.93 | 403552 | 0 | 0 | 0 | 1794 | 0 | |
| Total | 45042112 | 0.00 | 100.00 | 521.32 | 30.11TB | 100.00 | 717.84 | 49305115 | 0 | 0 | 0 | 3622673 | 0 | ||
 |
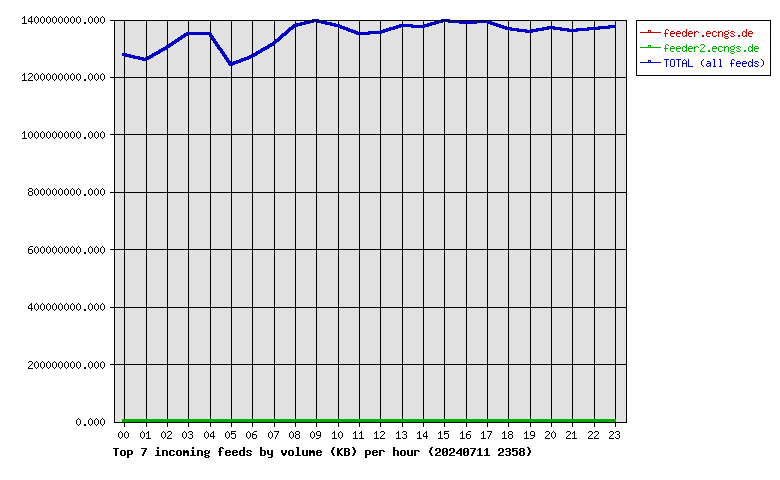
| Incoming Feed (+ Top1000 #) | Volume | %Vol | Kbps | Accepted | %Acc | %Tot | KB/art | Check | Ihave | Spam | TooOld | Rejs | Errs | ||
|---|---|---|---|---|---|---|---|---|---|---|---|---|---|---|---|
| 1 | feeder.ecngs.de | 30.11TB | 99.99 | 2993568.60 | 44740793 | 85.18 | 99.33 | 722.62 | 48901563 | 0 | 0 | 0 | 3620879 | 0 | |
| 2 | feeder2.ecngs.de | 2.57GB | 0.01 | 249.28 | 301319 | 74.34 | 0.67 | 8.93 | 403552 | 0 | 0 | 0 | 1794 | 0 | |
| Total | 30.11TB | 100.00 | 2993817.88 | 45042112 | 0.00 | 100.00 | 717.84 | 49305115 | 0 | 0 | 0 | 3622673 | 0 | ||
 |
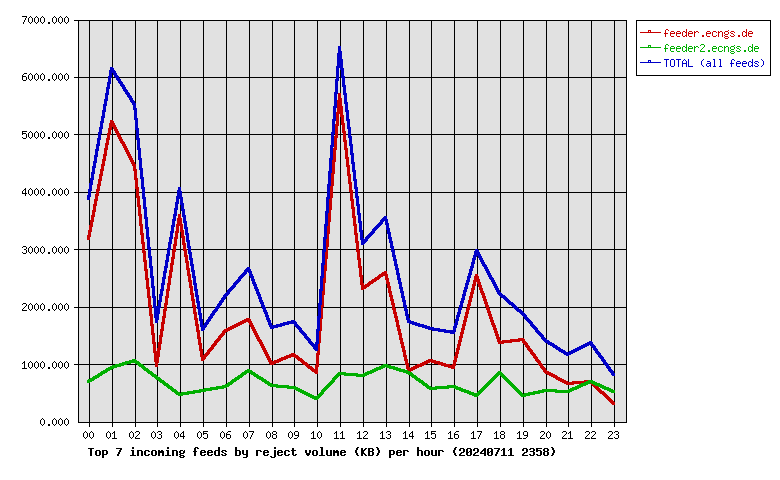
| Incoming Feed (+ Top1000 #) | Rej. Vol. | %Vol | Kbps | Accepted | %Acc | %Tot | KB/art | Check | Ihave | Spam | TooOld | Rejs | Errs | ||
|---|---|---|---|---|---|---|---|---|---|---|---|---|---|---|---|
| 1 | feeder.ecngs.de | 44.98MB | 74.09 | 4.26 | 44740793 | 85.18 | 99.33 | 722.62 | 48901563 | 0 | 0 | 0 | 3620879 | 0 | |
| 2 | feeder2.ecngs.de | 15.73MB | 25.91 | 1.49 | 301319 | 74.34 | 0.67 | 8.93 | 403552 | 0 | 0 | 0 | 1794 | 0 | |
| Total | 60.71MB | 100.00 | 5.76 | 45042112 | 0.00 | 100.00 | 717.84 | 49305115 | 0 | 0 | 0 | 3622673 | 0 | ||
 |
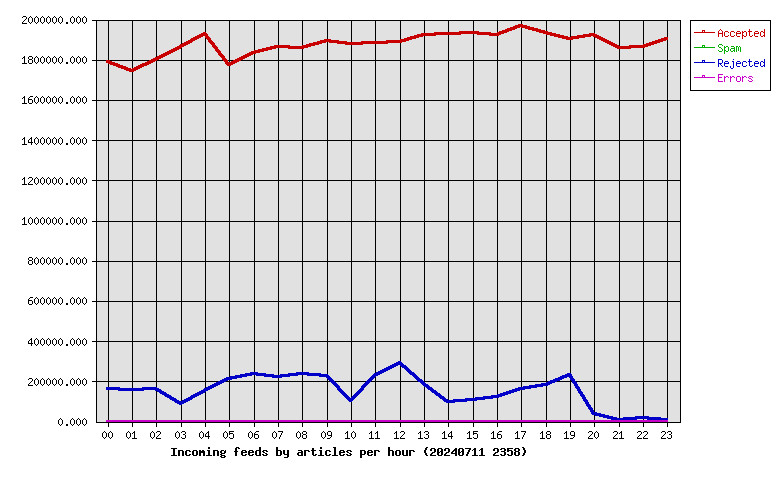
| Hour | Accepted | %Acc | Volume | %Vol | Check | Ihave | Spam | Rejs | Errs |
|---|---|---|---|---|---|---|---|---|---|
| 00 | 1787621 | 3.97 | 1.19TB | 3.95 | 1965748 | 0 | 0 | 160063 | 0 |
| 01 | 1741913 | 3.87 | 1.17TB | 3.90 | 1917688 | 0 | 0 | 157173 | 0 |
| 02 | 1796282 | 3.99 | 1.21TB | 4.02 | 1975740 | 0 | 0 | 161423 | 0 |
| 03 | 1862817 | 4.14 | 1.26TB | 4.18 | 1963361 | 0 | 0 | 86111 | 0 |
| 04 | 1925563 | 4.28 | 1.26TB | 4.17 | 2093231 | 0 | 0 | 154005 | 0 |
| 05 | 1776040 | 3.94 | 1.15TB | 3.84 | 2155584 | 0 | 0 | 212683 | 0 |
| 06 | 1835312 | 4.07 | 1.18TB | 3.93 | 2121853 | 0 | 0 | 234651 | 0 |
| 07 | 1864857 | 4.14 | 1.22TB | 4.07 | 2137467 | 0 | 0 | 219230 | 0 |
| 08 | 1859713 | 4.13 | 1.28TB | 4.26 | 2111925 | 0 | 0 | 234039 | 0 |
| 09 | 1892757 | 4.20 | 1.30TB | 4.31 | 2132456 | 0 | 0 | 224673 | 0 |
| 10 | 1877818 | 4.17 | 1.28TB | 4.26 | 1993381 | 0 | 0 | 100063 | 0 |
| 11 | 1882917 | 4.18 | 1.26TB | 4.17 | 2128160 | 0 | 0 | 228035 | 0 |
| 12 | 1885577 | 4.19 | 1.26TB | 4.19 | 2195439 | 0 | 0 | 291885 | 0 |
| 13 | 1921229 | 4.27 | 1.28TB | 4.26 | 2127350 | 0 | 0 | 188783 | 0 |
| 14 | 1925675 | 4.28 | 1.28TB | 4.25 | 2054065 | 0 | 0 | 98408 | 0 |
| 15 | 1931399 | 4.29 | 1.30TB | 4.32 | 2063527 | 0 | 0 | 107247 | 0 |
| 16 | 1920989 | 4.26 | 1.29TB | 4.29 | 2060706 | 0 | 0 | 120456 | 0 |
| 17 | 1969554 | 4.37 | 1.30TB | 4.30 | 2148832 | 0 | 0 | 161502 | 0 |
| 18 | 1932840 | 4.29 | 1.27TB | 4.23 | 2130186 | 0 | 0 | 183203 | 0 |
| 19 | 1903195 | 4.23 | 1.26TB | 4.19 | 2144234 | 0 | 0 | 230909 | 0 |
| 20 | 1924862 | 4.27 | 1.28TB | 4.24 | 1976961 | 0 | 0 | 37325 | 0 |
| 21 | 1856587 | 4.12 | 1.27TB | 4.20 | 1874635 | 0 | 0 | 5777 | 0 |
| 22 | 1864310 | 4.14 | 1.27TB | 4.23 | 1899594 | 0 | 0 | 16478 | 0 |
| 23 | 1902285 | 4.22 | 1.28TB | 4.25 | 1932992 | 0 | 0 | 8551 | 0 |
| Total | 45042112 | 100.00 | 30.11TB | 100.00 | 49305115 | 0 | 0 | 3622673 | 0 |
 |
| Outgoing Feed (+ Top1000 #) | Accepted | %Acc | %Tot | Art/sec | Volume | %Vol | KB/art | Dups | Rejs | % Ratio (Out/In) | ||
|---|---|---|---|---|---|---|---|---|---|---|---|---|
| 1 | 217.73.144.40 | 0 | 0.00 | 0.00 | 0.00 | 0.00KB | 0.00 | 0.00 | 44681274 | 0 | … | |
| Total | 0 | 0.00 | 0.00 | 0.00 | 0.00KB | 0.00 | 0.00 | 44681274 | 0 | |||
 |
| Outgoing Feed (+ Top1000 #) | Volume | %Vol | Kbps | Accepted | %Acc | %Tot | KB/art | Dups | Rejs | % Ratio (Out/In) | ||
|---|---|---|---|---|---|---|---|---|---|---|---|---|
| 1 | 217.73.144.40 | 0.00KB | 0.00 | 0.00 | 0 | 0.00 | 0.00 | 0.00 | 44681274 | 0 | … | |
| Total | 0.00KB | 0.00 | 0.00 | 0 | 0.00 | 0.00 | 0.00 | 44681274 | 0 | |||
 |
| Outgoing Feed (+ Top1000 #) | Rej. Vol. | %Vol | Kbps | Accepted | %Acc | %Tot | KB/art | Dups | Rejs | % Ratio (Out/In) | ||
|---|---|---|---|---|---|---|---|---|---|---|---|---|
| 1 | 217.73.144.40 | 0.00KB | 0.00 | 0.00 | 0 | 0.00 | 0.00 | 0.00 | 44681274 | 0 | … | |
| Total | 0.00KB | 0.00 | 0.00 | 0 | 0.00 | 0.00 | 0.00 | 44681274 | 0 | |||
 |
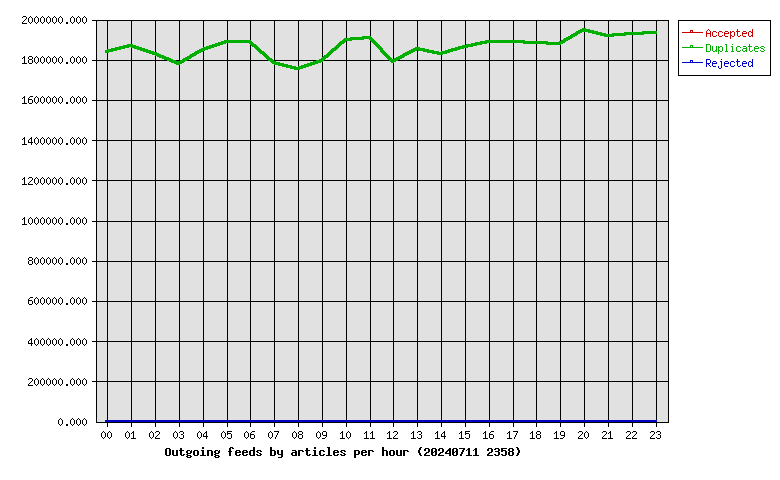
| Hour | Accepted | %Acc | Volume | %Vol | dups | Rejs |
|---|---|---|---|---|---|---|
| 00 | 0 | 0.00 | 0.00KB | 0.00 | 1839106 | 0 |
| 01 | 0 | 0.00 | 0.00KB | 0.00 | 1866502 | 0 |
| 02 | 0 | 0.00 | 0.00KB | 0.00 | 1828920 | 0 |
| 03 | 0 | 0.00 | 0.00KB | 0.00 | 1778814 | 0 |
| 04 | 0 | 0.00 | 0.00KB | 0.00 | 1847879 | 0 |
| 05 | 0 | 0.00 | 0.00KB | 0.00 | 1888559 | 0 |
| 06 | 0 | 0.00 | 0.00KB | 0.00 | 1890408 | 0 |
| 07 | 0 | 0.00 | 0.00KB | 0.00 | 1781716 | 0 |
| 08 | 0 | 0.00 | 0.00KB | 0.00 | 1753388 | 0 |
| 09 | 0 | 0.00 | 0.00KB | 0.00 | 1793534 | 0 |
| 10 | 0 | 0.00 | 0.00KB | 0.00 | 1900030 | 0 |
| 11 | 0 | 0.00 | 0.00KB | 0.00 | 1908974 | 0 |
| 12 | 0 | 0.00 | 0.00KB | 0.00 | 1790643 | 0 |
| 13 | 0 | 0.00 | 0.00KB | 0.00 | 1853227 | 0 |
| 14 | 0 | 0.00 | 0.00KB | 0.00 | 1829301 | 0 |
| 15 | 0 | 0.00 | 0.00KB | 0.00 | 1863343 | 0 |
| 16 | 0 | 0.00 | 0.00KB | 0.00 | 1887693 | 0 |
| 17 | 0 | 0.00 | 0.00KB | 0.00 | 1887136 | 0 |
| 18 | 0 | 0.00 | 0.00KB | 0.00 | 1881534 | 0 |
| 19 | 0 | 0.00 | 0.00KB | 0.00 | 1878900 | 0 |
| 20 | 0 | 0.00 | 0.00KB | 0.00 | 1949856 | 0 |
| 21 | 0 | 0.00 | 0.00KB | 0.00 | 1918513 | 0 |
| 22 | 0 | 0.00 | 0.00KB | 0.00 | 1927982 | 0 |
| 23 | 0 | 0.00 | 0.00KB | 0.00 | 1935316 | 0 |
| Total | 0 | 0.00 | 0.00KB | 0.00 | 44681274 | 0 |
 |
| >= 20% Full | >= 35% Full | >= 50% Full | >= 65% Full | >= 80% Full | >= 95% Full |
| Outgoing Feed | Batch Seq | Batch Num | Batch Max | %Full | Av. Pending |
|---|---|---|---|---|---|
| nbr.elbracht.net-o | 968192-968273 | 81 | 500 | 16 | 0.0 |
| text-spool-out | 0-0 | 0 | 500 | 0 | 0.0 |
| 1st Time | Last Time | # Msgs | Message |
|---|---|---|---|
| 14:44:11 | 14:44:17 | 3 | DNS Fwd/Rev mismatch: lookup of scanner-27.ch1.censys-scanner.com failed |
| 16:13:11 | 1 | DNS Fwd/Rev mismatch: visit.keznews.com/194.165.16.73 |