| |
DIABLO statistics for newsfeed.yoursite.com on Wed 10 Jul 2024 |
Generated on 20240710 2358 by feeder-stats v4.006. Copyright © 2002 The Diablo Project.
Diablo running processes:  88    Dnewslink running processes:  1


12:00AM  up 143 days,  7:19, 0 users, load averages: 10.26, 9.82, 9.25

Filesystem     Size    Used   Avail Capacity  Mounted on
/dev/da0s1g     94G    2.1G     84G     2%    /news
/dev/da1       7.3T    6.7T     45G    99%    /news2/spool/news/00
/dev/da2       7.3T    6.7T     52G    99%    /news2/spool/news/01
/dev/da3       3.7T    3.3T     55G    98%    /news2/spool/news/02
/dev/da4       5.5T      5T     71G    99%    /news2/spool/news/03
/dev/da8       7.3T    6.6T     57G    99%    /news2/spool/news/04
/dev/da9       7.3T    6.6T     57G    99%    /news2/spool/news/05
/dev/da10      7.3T    6.7T     43G    99%    /news2/spool/news/06
/dev/da11      5.5T      5T     88G    98%    /news2/spool/news/07
/dev/da12      5.5T      5T     76G    99%    /news2/spool/news/08
/dev/da13      7.3T    6.7T     50G    99%    /news2/spool/news/09
/dev/da14      7.3T    6.7T     54G    99%    /news2/spool/news/10
/dev/da15      7.3T    6.7T     47G    99%    /news2/spool/news/11
/dev/da16      7.3T    6.7T     49G    99%    /news2/spool/news/12
/dev/da17      7.3T    6.7T     46G    99%    /news2/spool/news/13
/dev/da18      7.3T    6.7T     50G    99%    /news2/spool/news/14
/dev/da19      7.3T    6.7T     53G    99%    /news2/spool/news/15
/dev/da20      7.3T    6.7T     43G    99%    /news2/spool/news/16
/dev/da21      7.3T    6.7T     50G    99%    /news2/spool/news/17
/dev/da22      7.3T    6.7T     49G    99%    /news2/spool/news/18
/dev/da23      7.3T    6.7T     50G    99%    /news2/spool/news/19
/dev/da24      7.3T    6.7T     52G    99%    /news2/spool/news/20
/dev/da25      7.3T    6.7T     48G    99%    /news2/spool/news/21
/dev/da26      7.3T    6.7T     50G    99%    /news2/spool/news/22
/dev/da5       221G     36G    167G    18%    /news1
/dev/md0        40G     15G     20G    43%    /news3
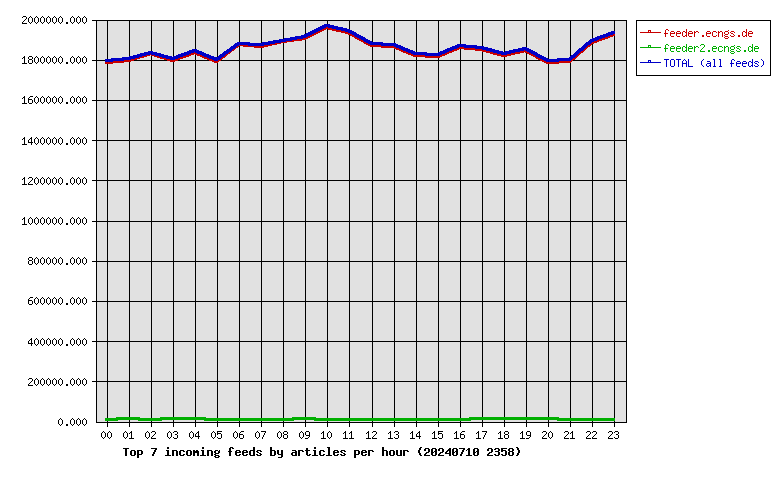
| Incoming Feed (+ Top1000 #) | Accepted | %Acc | %Tot | Art/sec | Volume | %Vol | KB/art | Check | Ihave | Spam | TooOld | Rejs | Errs | ||
|---|---|---|---|---|---|---|---|---|---|---|---|---|---|---|---|
| 1 | feeder.ecngs.de | 44340781 | 84.71 | 99.50 | 513.20 | 29.74TB | 99.99 | 720.11 | 48540476 | 0 | 0 | 0 | 3801190 | 0 | |
| 2 | feeder2.ecngs.de | 223262 | 73.03 | 0.50 | 2.59 | 2.00GB | 0.01 | 9.40 | 304010 | 0 | 0 | 0 | 1701 | 0 | |
| Total | 44564043 | 0.00 | 100.00 | 515.80 | 29.74TB | 100.00 | 716.55 | 48844486 | 0 | 0 | 0 | 3802891 | 0 | ||
 |
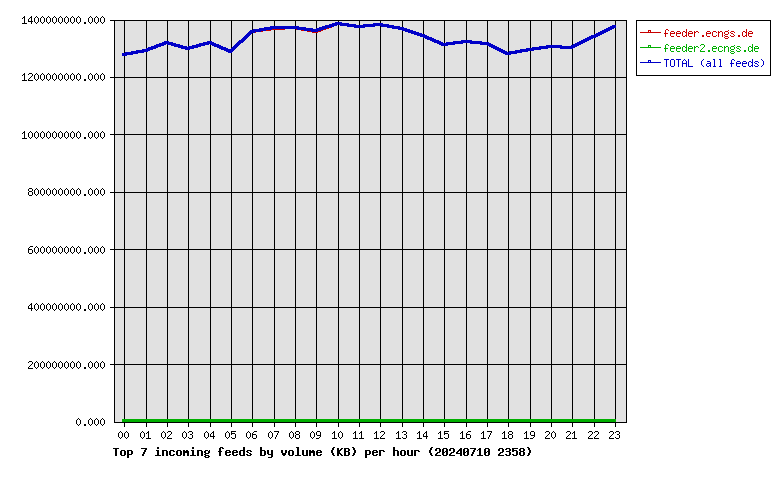
| Incoming Feed (+ Top1000 #) | Volume | %Vol | Kbps | Accepted | %Acc | %Tot | KB/art | Check | Ihave | Spam | TooOld | Rejs | Errs | ||
|---|---|---|---|---|---|---|---|---|---|---|---|---|---|---|---|
| 1 | feeder.ecngs.de | 29.74TB | 99.99 | 2956496.79 | 44340781 | 84.71 | 99.50 | 720.11 | 48540476 | 0 | 0 | 0 | 3801190 | 0 | |
| 2 | feeder2.ecngs.de | 2.00GB | 0.01 | 195.07 | 223262 | 73.03 | 0.50 | 9.40 | 304010 | 0 | 0 | 0 | 1701 | 0 | |
| Total | 29.74TB | 100.00 | 2956691.86 | 44564043 | 0.00 | 100.00 | 716.55 | 48844486 | 0 | 0 | 0 | 3802891 | 0 | ||
 |
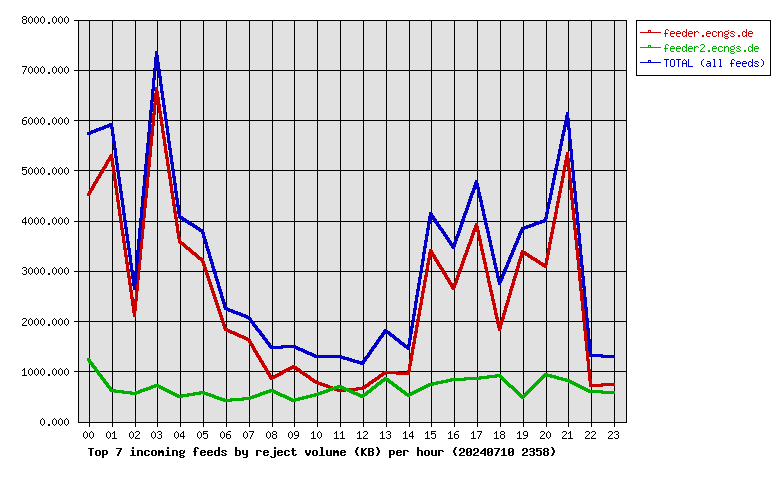
| Incoming Feed (+ Top1000 #) | Rej. Vol. | %Vol | Kbps | Accepted | %Acc | %Tot | KB/art | Check | Ihave | Spam | TooOld | Rejs | Errs | ||
|---|---|---|---|---|---|---|---|---|---|---|---|---|---|---|---|
| 1 | feeder.ecngs.de | 58.13MB | 79.14 | 5.51 | 44340781 | 84.71 | 99.50 | 720.11 | 48540476 | 0 | 0 | 0 | 3801190 | 0 | |
| 2 | feeder2.ecngs.de | 15.33MB | 20.86 | 1.46 | 223262 | 73.03 | 0.50 | 9.40 | 304010 | 0 | 0 | 0 | 1701 | 0 | |
| Total | 73.46MB | 100.00 | 6.97 | 44564043 | 0.00 | 100.00 | 716.55 | 48844486 | 0 | 0 | 0 | 3802891 | 0 | ||
 |
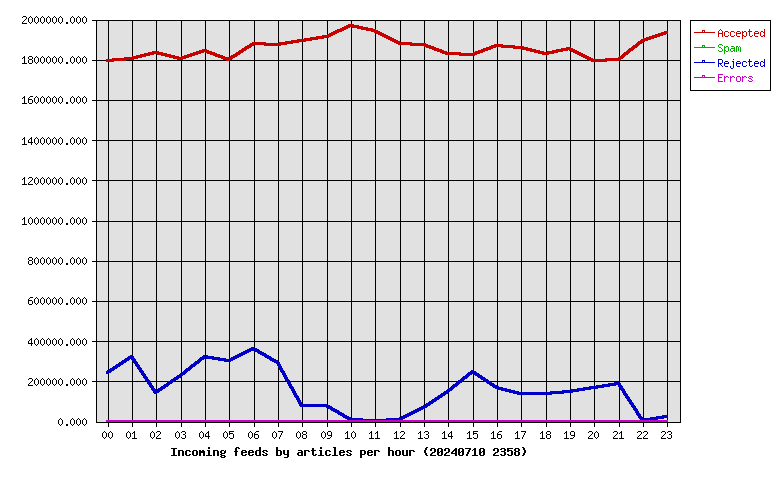
| Hour | Accepted | %Acc | Volume | %Vol | Check | Ihave | Spam | Rejs | Errs |
|---|---|---|---|---|---|---|---|---|---|
| 00 | 1792950 | 4.02 | 1.19TB | 3.99 | 2050654 | 0 | 0 | 240019 | 0 |
| 01 | 1802887 | 4.05 | 1.20TB | 4.04 | 2146222 | 0 | 0 | 322873 | 0 |
| 02 | 1832270 | 4.11 | 1.23TB | 4.13 | 1986966 | 0 | 0 | 143893 | 0 |
| 03 | 1804250 | 4.05 | 1.21TB | 4.07 | 2048719 | 0 | 0 | 225068 | 0 |
| 04 | 1841017 | 4.13 | 1.23TB | 4.13 | 2181144 | 0 | 0 | 323183 | 0 |
| 05 | 1796722 | 4.03 | 1.20TB | 4.03 | 2169206 | 0 | 0 | 300073 | 0 |
| 06 | 1880265 | 4.22 | 1.26TB | 4.25 | 2253592 | 0 | 0 | 362699 | 0 |
| 07 | 1871050 | 4.20 | 1.27TB | 4.29 | 2173087 | 0 | 0 | 289271 | 0 |
| 08 | 1894870 | 4.25 | 1.28TB | 4.29 | 1987445 | 0 | 0 | 78273 | 0 |
| 09 | 1912777 | 4.29 | 1.26TB | 4.25 | 2008052 | 0 | 0 | 76192 | 0 |
| 10 | 1965417 | 4.41 | 1.29TB | 4.34 | 1986105 | 0 | 0 | 7326 | 0 |
| 11 | 1941507 | 4.36 | 1.28TB | 4.30 | 1957038 | 0 | 0 | 109 | 0 |
| 12 | 1878661 | 4.22 | 1.29TB | 4.33 | 1902406 | 0 | 0 | 9477 | 0 |
| 13 | 1872413 | 4.20 | 1.27TB | 4.28 | 1951898 | 0 | 0 | 64901 | 0 |
| 14 | 1827876 | 4.10 | 1.25TB | 4.21 | 1990818 | 0 | 0 | 149139 | 0 |
| 15 | 1823605 | 4.09 | 1.22TB | 4.10 | 2084719 | 0 | 0 | 245227 | 0 |
| 16 | 1867433 | 4.19 | 1.23TB | 4.14 | 2048199 | 0 | 0 | 165307 | 0 |
| 17 | 1860240 | 4.17 | 1.22TB | 4.11 | 2014345 | 0 | 0 | 136358 | 0 |
| 18 | 1827759 | 4.10 | 1.19TB | 4.01 | 1986950 | 0 | 0 | 138767 | 0 |
| 19 | 1852274 | 4.16 | 1.21TB | 4.05 | 2033775 | 0 | 0 | 148782 | 0 |
| 20 | 1793260 | 4.02 | 1.22TB | 4.09 | 1981055 | 0 | 0 | 165359 | 0 |
| 21 | 1798607 | 4.04 | 1.21TB | 4.07 | 2024228 | 0 | 0 | 186625 | 0 |
| 22 | 1893399 | 4.25 | 1.25TB | 4.19 | 1907413 | 0 | 0 | 137 | 0 |
| 23 | 1932534 | 4.34 | 1.28TB | 4.30 | 1970450 | 0 | 0 | 23833 | 0 |
| Total | 44564043 | 100.00 | 29.74TB | 100.00 | 48844486 | 0 | 0 | 3802891 | 0 |
 |
| Outgoing Feed (+ Top1000 #) | Accepted | %Acc | %Tot | Art/sec | Volume | %Vol | KB/art | Dups | Rejs | % Ratio (Out/In) | ||
|---|---|---|---|---|---|---|---|---|---|---|---|---|
| 1 | 217.73.144.40 | 0 | 0.00 | 0.00 | 0.00 | 0.00KB | 0.00 | 0.00 | 44534103 | 0 | … | |
| Total | 0 | 0.00 | 0.00 | 0.00 | 0.00KB | 0.00 | 0.00 | 44534103 | 0 | |||
 |
| Outgoing Feed (+ Top1000 #) | Volume | %Vol | Kbps | Accepted | %Acc | %Tot | KB/art | Dups | Rejs | % Ratio (Out/In) | ||
|---|---|---|---|---|---|---|---|---|---|---|---|---|
| 1 | 217.73.144.40 | 0.00KB | 0.00 | 0.00 | 0 | 0.00 | 0.00 | 0.00 | 44534103 | 0 | … | |
| Total | 0.00KB | 0.00 | 0.00 | 0 | 0.00 | 0.00 | 0.00 | 44534103 | 0 | |||
 |
| Outgoing Feed (+ Top1000 #) | Rej. Vol. | %Vol | Kbps | Accepted | %Acc | %Tot | KB/art | Dups | Rejs | % Ratio (Out/In) | ||
|---|---|---|---|---|---|---|---|---|---|---|---|---|
| 1 | 217.73.144.40 | 0.00KB | 0.00 | 0.00 | 0 | 0.00 | 0.00 | 0.00 | 44534103 | 0 | … | |
| Total | 0.00KB | 0.00 | 0.00 | 0 | 0.00 | 0.00 | 0.00 | 44534103 | 0 | |||
 |
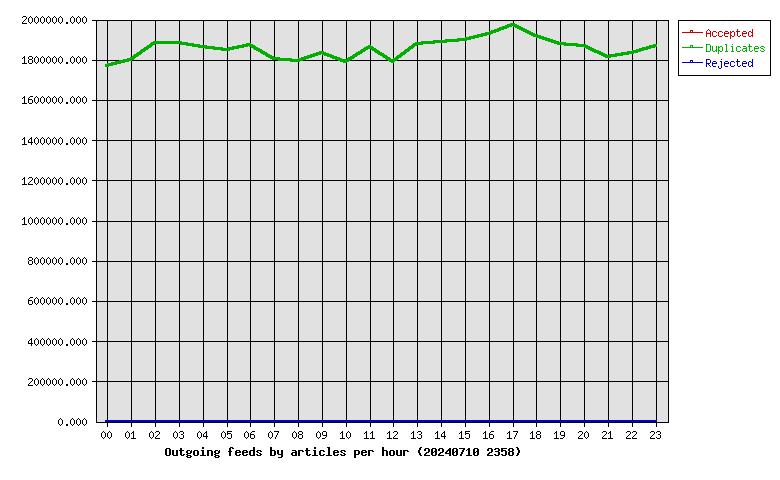
| Hour | Accepted | %Acc | Volume | %Vol | dups | Rejs |
|---|---|---|---|---|---|---|
| 00 | 0 | 0.00 | 0.00KB | 0.00 | 1769688 | 0 |
| 01 | 0 | 0.00 | 0.00KB | 0.00 | 1797312 | 0 |
| 02 | 0 | 0.00 | 0.00KB | 0.00 | 1883280 | 0 |
| 03 | 0 | 0.00 | 0.00KB | 0.00 | 1881456 | 0 |
| 04 | 0 | 0.00 | 0.00KB | 0.00 | 1865170 | 0 |
| 05 | 0 | 0.00 | 0.00KB | 0.00 | 1846174 | 0 |
| 06 | 0 | 0.00 | 0.00KB | 0.00 | 1874428 | 0 |
| 07 | 0 | 0.00 | 0.00KB | 0.00 | 1805935 | 0 |
| 08 | 0 | 0.00 | 0.00KB | 0.00 | 1794096 | 0 |
| 09 | 0 | 0.00 | 0.00KB | 0.00 | 1834084 | 0 |
| 10 | 0 | 0.00 | 0.00KB | 0.00 | 1790895 | 0 |
| 11 | 0 | 0.00 | 0.00KB | 0.00 | 1861656 | 0 |
| 12 | 0 | 0.00 | 0.00KB | 0.00 | 1788950 | 0 |
| 13 | 0 | 0.00 | 0.00KB | 0.00 | 1879404 | 0 |
| 14 | 0 | 0.00 | 0.00KB | 0.00 | 1887724 | 0 |
| 15 | 0 | 0.00 | 0.00KB | 0.00 | 1897231 | 0 |
| 16 | 0 | 0.00 | 0.00KB | 0.00 | 1927198 | 0 |
| 17 | 0 | 0.00 | 0.00KB | 0.00 | 1973318 | 0 |
| 18 | 0 | 0.00 | 0.00KB | 0.00 | 1917930 | 0 |
| 19 | 0 | 0.00 | 0.00KB | 0.00 | 1878252 | 0 |
| 20 | 0 | 0.00 | 0.00KB | 0.00 | 1867148 | 0 |
| 21 | 0 | 0.00 | 0.00KB | 0.00 | 1812456 | 0 |
| 22 | 0 | 0.00 | 0.00KB | 0.00 | 1833590 | 0 |
| 23 | 0 | 0.00 | 0.00KB | 0.00 | 1866728 | 0 |
| Total | 0 | 0.00 | 0.00KB | 0.00 | 44534103 | 0 |
 |
| >= 20% Full | >= 35% Full | >= 50% Full | >= 65% Full | >= 80% Full | >= 95% Full |
| Outgoing Feed | Batch Seq | Batch Num | Batch Max | %Full | Av. Pending |
|---|---|---|---|---|---|
| nbr.elbracht.net-o | 967904-967985 | 81 | 500 | 16 | 0.0 |
| text-spool-out | 0-0 | 0 | 500 | 0 | 0.0 |
| 1st Time | Last Time | # Msgs | Message |
|---|---|---|---|
| 21:19:43 | 21:19:59 | 3 | DNS Fwd/Rev mismatch: lookup of scanner-06.ch1.censys-scanner.com failed |