| |
DIABLO statistics for newsfeed.yoursite.com on Tue 09 Jul 2024 |
Generated on 20240709 2358 by feeder-stats v4.006. Copyright © 2002 The Diablo Project.
Diablo running processes:  92    Dnewslink running processes:  0


12:00AM  up 142 days,  7:19, 0 users, load averages: 15.16, 11.60, 10.54

Filesystem     Size    Used   Avail Capacity  Mounted on
/dev/da0s1g     94G    2.0G     84G     2%    /news
/dev/da1       7.3T    6.6T     74G    99%    /news2/spool/news/00
/dev/da2       7.3T    6.6T     83G    99%    /news2/spool/news/01
/dev/da3       3.7T    3.3T     93G    97%    /news2/spool/news/02
/dev/da4       5.5T      5T     63G    99%    /news2/spool/news/03
/dev/da8       7.3T    6.6T     88G    99%    /news2/spool/news/04
/dev/da9       7.3T    6.6T     87G    99%    /news2/spool/news/05
/dev/da10      7.3T    6.6T     74G    99%    /news2/spool/news/06
/dev/da11      5.5T      5T     39G    99%    /news2/spool/news/07
/dev/da12      5.5T      5T     56G    99%    /news2/spool/news/08
/dev/da13      7.3T    6.6T     84G    99%    /news2/spool/news/09
/dev/da14      7.3T    6.6T     82G    99%    /news2/spool/news/10
/dev/da15      7.3T    6.6T     78G    99%    /news2/spool/news/11
/dev/da16      7.3T    6.6T     83G    99%    /news2/spool/news/12
/dev/da17      7.3T    6.6T     78G    99%    /news2/spool/news/13
/dev/da18      7.3T    6.6T     84G    99%    /news2/spool/news/14
/dev/da19      7.3T    6.6T     85G    99%    /news2/spool/news/15
/dev/da20      7.3T    6.6T     74G    99%    /news2/spool/news/16
/dev/da21      7.3T    6.6T     82G    99%    /news2/spool/news/17
/dev/da22      7.3T    6.6T     77G    99%    /news2/spool/news/18
/dev/da23      7.3T    6.6T     83G    99%    /news2/spool/news/19
/dev/da24      7.3T    6.6T     84G    99%    /news2/spool/news/20
/dev/da25      7.3T    6.6T     77G    99%    /news2/spool/news/21
/dev/da26      7.3T    6.6T     80G    99%    /news2/spool/news/22
/dev/da5       221G     36G    167G    18%    /news1
/dev/md0        40G     15G     20G    43%    /news3
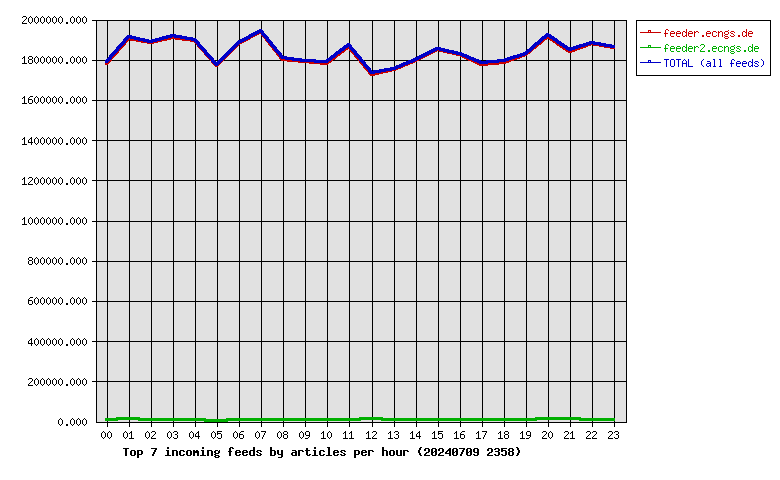
| Incoming Feed (+ Top1000 #) | Accepted | %Acc | %Tot | Art/sec | Volume | %Vol | KB/art | Check | Ihave | Spam | TooOld | Rejs | Errs | ||
|---|---|---|---|---|---|---|---|---|---|---|---|---|---|---|---|
| 1 | feeder.ecngs.de | 43983698 | 82.85 | 99.59 | 509.07 | 29.54TB | 99.99 | 721.11 | 48698426 | 0 | 0 | 0 | 4390577 | 0 | |
| 2 | feeder2.ecngs.de | 182277 | 71.78 | 0.41 | 2.11 | 1.56GB | 0.01 | 8.99 | 252360 | 0 | 0 | 0 | 1567 | 0 | |
| Total | 44165975 | 0.00 | 100.00 | 511.18 | 29.54TB | 100.00 | 718.17 | 48950786 | 0 | 0 | 0 | 4392144 | 0 | ||
 |
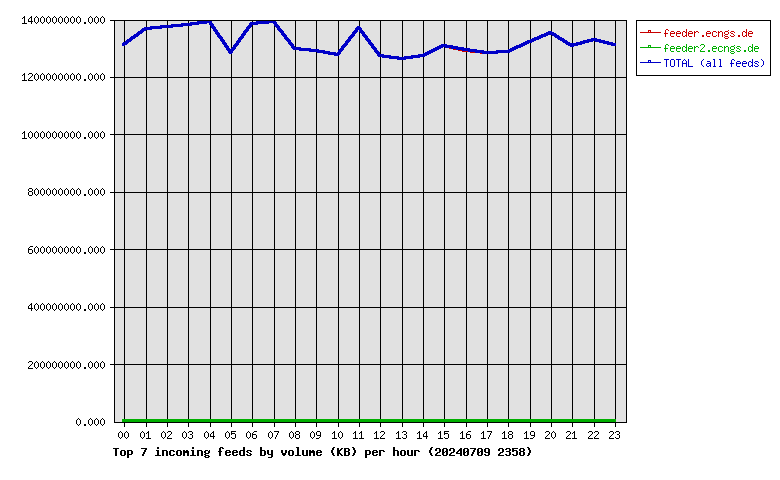
| Incoming Feed (+ Top1000 #) | Volume | %Vol | Kbps | Accepted | %Acc | %Tot | KB/art | Check | Ihave | Spam | TooOld | Rejs | Errs | ||
|---|---|---|---|---|---|---|---|---|---|---|---|---|---|---|---|
| 1 | feeder.ecngs.de | 29.54TB | 99.99 | 2936766.15 | 43983698 | 82.85 | 99.59 | 721.11 | 48698426 | 0 | 0 | 0 | 4390577 | 0 | |
| 2 | feeder2.ecngs.de | 1.56GB | 0.01 | 152.02 | 182277 | 71.78 | 0.41 | 8.99 | 252360 | 0 | 0 | 0 | 1567 | 0 | |
| Total | 29.54TB | 100.00 | 2936918.17 | 44165975 | 0.00 | 100.00 | 718.17 | 48950786 | 0 | 0 | 0 | 4392144 | 0 | ||
 |
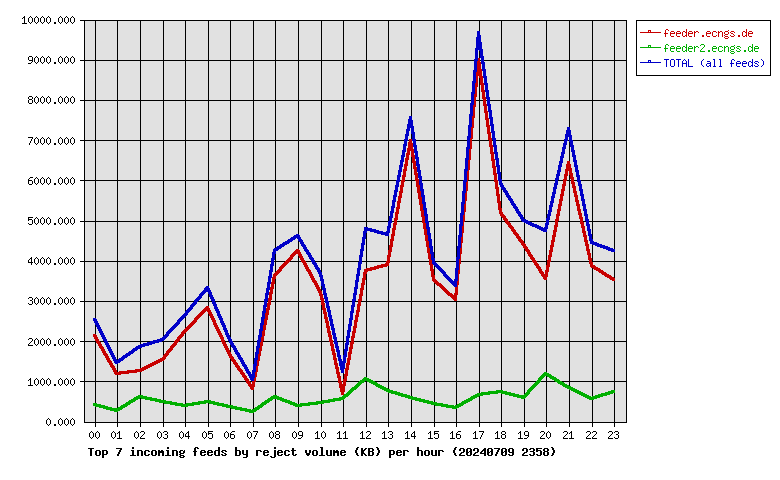
| Incoming Feed (+ Top1000 #) | Rej. Vol. | %Vol | Kbps | Accepted | %Acc | %Tot | KB/art | Check | Ihave | Spam | TooOld | Rejs | Errs | ||
|---|---|---|---|---|---|---|---|---|---|---|---|---|---|---|---|
| 1 | feeder.ecngs.de | 80.53MB | 85.77 | 7.63 | 43983698 | 82.85 | 99.59 | 721.11 | 48698426 | 0 | 0 | 0 | 4390577 | 0 | |
| 2 | feeder2.ecngs.de | 13.36MB | 14.23 | 1.27 | 182277 | 71.78 | 0.41 | 8.99 | 252360 | 0 | 0 | 0 | 1567 | 0 | |
| Total | 93.89MB | 100.00 | 8.90 | 44165975 | 0.00 | 100.00 | 718.17 | 48950786 | 0 | 0 | 0 | 4392144 | 0 | ||
 |
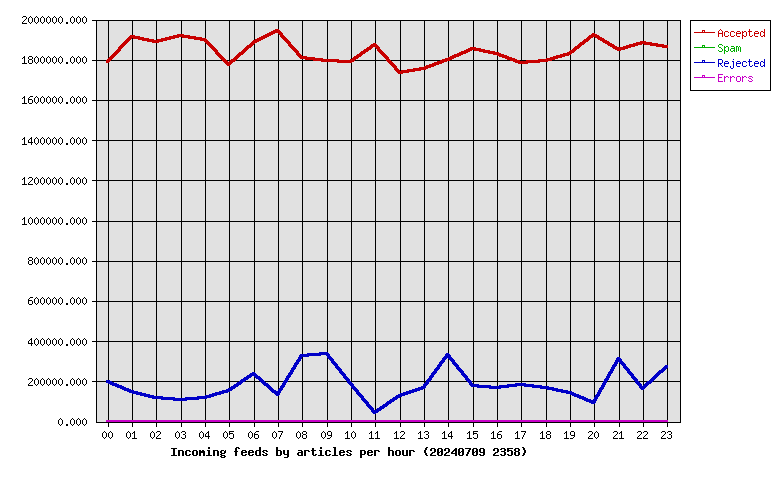
| Hour | Accepted | %Acc | Volume | %Vol | Check | Ihave | Spam | Rejs | Errs |
|---|---|---|---|---|---|---|---|---|---|
| 00 | 1788398 | 4.05 | 1.22TB | 4.13 | 2001134 | 0 | 0 | 197558 | 0 |
| 01 | 1913724 | 4.33 | 1.27TB | 4.31 | 2077738 | 0 | 0 | 146581 | 0 |
| 02 | 1889297 | 4.28 | 1.28TB | 4.33 | 2015996 | 0 | 0 | 116804 | 0 |
| 03 | 1916446 | 4.34 | 1.29TB | 4.35 | 2035173 | 0 | 0 | 105519 | 0 |
| 04 | 1900068 | 4.30 | 1.29TB | 4.38 | 2026370 | 0 | 0 | 114621 | 0 |
| 05 | 1774455 | 4.02 | 1.20TB | 4.05 | 2005912 | 0 | 0 | 149805 | 0 |
| 06 | 1881827 | 4.26 | 1.29TB | 4.37 | 2130388 | 0 | 0 | 238610 | 0 |
| 07 | 1942738 | 4.40 | 1.30TB | 4.39 | 2082727 | 0 | 0 | 129697 | 0 |
| 08 | 1807853 | 4.09 | 1.21TB | 4.09 | 2146862 | 0 | 0 | 326505 | 0 |
| 09 | 1792309 | 4.06 | 1.20TB | 4.07 | 2137284 | 0 | 0 | 335243 | 0 |
| 10 | 1787754 | 4.05 | 1.19TB | 4.02 | 1990656 | 0 | 0 | 188507 | 0 |
| 11 | 1870694 | 4.24 | 1.28TB | 4.32 | 1925537 | 0 | 0 | 41566 | 0 |
| 12 | 1733195 | 3.92 | 1.19TB | 4.02 | 1880753 | 0 | 0 | 128320 | 0 |
| 13 | 1755508 | 3.97 | 1.18TB | 3.98 | 1933957 | 0 | 0 | 165569 | 0 |
| 14 | 1800619 | 4.08 | 1.19TB | 4.01 | 2144676 | 0 | 0 | 333211 | 0 |
| 15 | 1855201 | 4.20 | 1.22TB | 4.12 | 2042162 | 0 | 0 | 175780 | 0 |
| 16 | 1827950 | 4.14 | 1.20TB | 4.07 | 2003361 | 0 | 0 | 164376 | 0 |
| 17 | 1782757 | 4.04 | 1.19TB | 4.04 | 1980194 | 0 | 0 | 183910 | 0 |
| 18 | 1791997 | 4.06 | 1.20TB | 4.06 | 1974619 | 0 | 0 | 167433 | 0 |
| 19 | 1830513 | 4.14 | 1.23TB | 4.16 | 1986920 | 0 | 0 | 144265 | 0 |
| 20 | 1924536 | 4.36 | 1.26TB | 4.26 | 2036870 | 0 | 0 | 94133 | 0 |
| 21 | 1850193 | 4.19 | 1.22TB | 4.12 | 2182993 | 0 | 0 | 310506 | 0 |
| 22 | 1883608 | 4.26 | 1.24TB | 4.19 | 2057698 | 0 | 0 | 162041 | 0 |
| 23 | 1864335 | 4.22 | 1.22TB | 4.13 | 2150806 | 0 | 0 | 271584 | 0 |
| Total | 44165975 | 100.00 | 29.54TB | 100.00 | 48950786 | 0 | 0 | 4392144 | 0 |
 |
| Outgoing Feed (+ Top1000 #) | Accepted | %Acc | %Tot | Art/sec | Volume | %Vol | KB/art | Dups | Rejs | % Ratio (Out/In) | ||
|---|---|---|---|---|---|---|---|---|---|---|---|---|
| 1 | 217.73.144.40 | 0 | 0.00 | 0.00 | 0.00 | 0.00KB | 0.00 | 0.00 | 44331486 | 0 | … | |
| Total | 0 | 0.00 | 0.00 | 0.00 | 0.00KB | 0.00 | 0.00 | 44331486 | 0 | |||
 |
| Outgoing Feed (+ Top1000 #) | Volume | %Vol | Kbps | Accepted | %Acc | %Tot | KB/art | Dups | Rejs | % Ratio (Out/In) | ||
|---|---|---|---|---|---|---|---|---|---|---|---|---|
| 1 | 217.73.144.40 | 0.00KB | 0.00 | 0.00 | 0 | 0.00 | 0.00 | 0.00 | 44331486 | 0 | … | |
| Total | 0.00KB | 0.00 | 0.00 | 0 | 0.00 | 0.00 | 0.00 | 44331486 | 0 | |||
 |
| Outgoing Feed (+ Top1000 #) | Rej. Vol. | %Vol | Kbps | Accepted | %Acc | %Tot | KB/art | Dups | Rejs | % Ratio (Out/In) | ||
|---|---|---|---|---|---|---|---|---|---|---|---|---|
| 1 | 217.73.144.40 | 0.00KB | 0.00 | 0.00 | 0 | 0.00 | 0.00 | 0.00 | 44331486 | 0 | … | |
| Total | 0.00KB | 0.00 | 0.00 | 0 | 0.00 | 0.00 | 0.00 | 44331486 | 0 | |||
 |
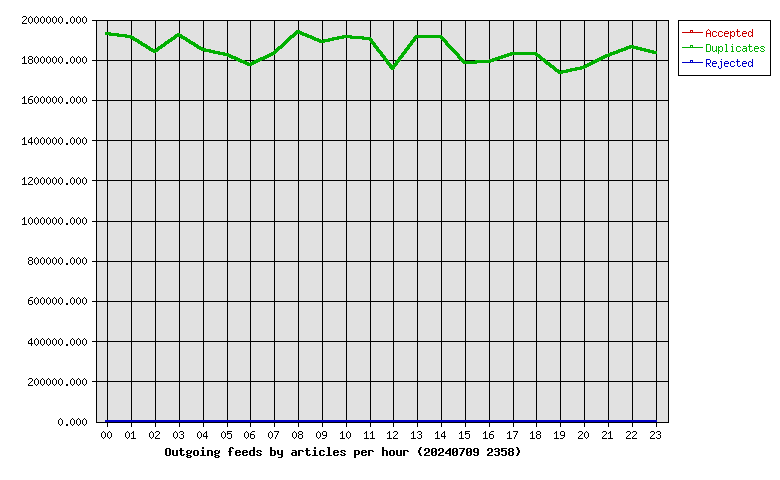
| Hour | Accepted | %Acc | Volume | %Vol | dups | Rejs |
|---|---|---|---|---|---|---|
| 00 | 0 | 0.00 | 0.00KB | 0.00 | 1928726 | 0 |
| 01 | 0 | 0.00 | 0.00KB | 0.00 | 1910792 | 0 |
| 02 | 0 | 0.00 | 0.00KB | 0.00 | 1838595 | 0 |
| 03 | 0 | 0.00 | 0.00KB | 0.00 | 1922591 | 0 |
| 04 | 0 | 0.00 | 0.00KB | 0.00 | 1847859 | 0 |
| 05 | 0 | 0.00 | 0.00KB | 0.00 | 1822980 | 0 |
| 06 | 0 | 0.00 | 0.00KB | 0.00 | 1772199 | 0 |
| 07 | 0 | 0.00 | 0.00KB | 0.00 | 1829109 | 0 |
| 08 | 0 | 0.00 | 0.00KB | 0.00 | 1938411 | 0 |
| 09 | 0 | 0.00 | 0.00KB | 0.00 | 1889696 | 0 |
| 10 | 0 | 0.00 | 0.00KB | 0.00 | 1914430 | 0 |
| 11 | 0 | 0.00 | 0.00KB | 0.00 | 1902220 | 0 |
| 12 | 0 | 0.00 | 0.00KB | 0.00 | 1755742 | 0 |
| 13 | 0 | 0.00 | 0.00KB | 0.00 | 1911958 | 0 |
| 14 | 0 | 0.00 | 0.00KB | 0.00 | 1910622 | 0 |
| 15 | 0 | 0.00 | 0.00KB | 0.00 | 1784369 | 0 |
| 16 | 0 | 0.00 | 0.00KB | 0.00 | 1789632 | 0 |
| 17 | 0 | 0.00 | 0.00KB | 0.00 | 1830544 | 0 |
| 18 | 0 | 0.00 | 0.00KB | 0.00 | 1827118 | 0 |
| 19 | 0 | 0.00 | 0.00KB | 0.00 | 1732241 | 0 |
| 20 | 0 | 0.00 | 0.00KB | 0.00 | 1759463 | 0 |
| 21 | 0 | 0.00 | 0.00KB | 0.00 | 1816918 | 0 |
| 22 | 0 | 0.00 | 0.00KB | 0.00 | 1862695 | 0 |
| 23 | 0 | 0.00 | 0.00KB | 0.00 | 1832576 | 0 |
| Total | 0 | 0.00 | 0.00KB | 0.00 | 44331486 | 0 |
 |
| >= 20% Full | >= 35% Full | >= 50% Full | >= 65% Full | >= 80% Full | >= 95% Full |
| Outgoing Feed | Batch Seq | Batch Num | Batch Max | %Full | Av. Pending |
|---|---|---|---|---|---|
| nbr.elbracht.net-o | 967616-967697 | 81 | 500 | 16 | 0.0 |
| text-spool-out | 0-0 | 0 | 500 | 0 | 0.0 |
| 1st Time | Last Time | # Msgs | Message |
|---|---|---|---|
| 22:16:44 | 22:16:57 | 5 | DNS Fwd/Rev mismatch: lookup of scanner-07.ch1.censys-scanner.com failed |
| 22:24:20 | 22:24:27 | 3 | DNS Fwd/Rev mismatch: lookup of scanner-27.ch1.censys-scanner.com failed |
| 01:52:55 | 1 | DNS Fwd/Rev mismatch: internettl.org/104.152.52.233 | |
| 01:53:25 | 1 | DNS Fwd/Rev mismatch: internettl.org/104.152.52.124 |