| |
DIABLO statistics for newsfeed.yoursite.com on Mon 08 Jul 2024 |
Generated on 20240708 2358 by feeder-stats v4.006. Copyright © 2002 The Diablo Project.
Diablo running processes:  88    Dnewslink running processes:  1


12:00AM  up 141 days,  7:19, 0 users, load averages: 9.15, 8.77, 9.04

Filesystem     Size    Used   Avail Capacity  Mounted on
/dev/da0s1g     94G    2.1G     84G     2%    /news
/dev/da1       7.3T    6.7T     42G    99%    /news2/spool/news/00
/dev/da2       7.3T    6.7T     50G    99%    /news2/spool/news/01
/dev/da3       3.7T    3.3T     90G    97%    /news2/spool/news/02
/dev/da4       5.5T      5T     53G    99%    /news2/spool/news/03
/dev/da8       7.3T    6.7T     55G    99%    /news2/spool/news/04
/dev/da9       7.3T    6.7T     55G    99%    /news2/spool/news/05
/dev/da10      7.3T    6.7T     40G    99%    /news2/spool/news/06
/dev/da11      5.5T      5T     81G    98%    /news2/spool/news/07
/dev/da12      5.5T      5T     72G    99%    /news2/spool/news/08
/dev/da13      7.3T    6.7T     54G    99%    /news2/spool/news/09
/dev/da14      7.3T    6.7T     48G    99%    /news2/spool/news/10
/dev/da15      7.3T    6.7T     43G    99%    /news2/spool/news/11
/dev/da16      7.3T    6.7T     52G    99%    /news2/spool/news/12
/dev/da17      7.3T    6.7T     43G    99%    /news2/spool/news/13
/dev/da18      7.3T    6.7T     55G    99%    /news2/spool/news/14
/dev/da19      7.3T    6.7T     53G    99%    /news2/spool/news/15
/dev/da20      7.3T    6.7T     42G    99%    /news2/spool/news/16
/dev/da21      7.3T    6.7T     51G    99%    /news2/spool/news/17
/dev/da22      7.3T    6.7T     46G    99%    /news2/spool/news/18
/dev/da23      7.3T    6.7T     52G    99%    /news2/spool/news/19
/dev/da24      7.3T    6.7T     53G    99%    /news2/spool/news/20
/dev/da25      7.3T    6.7T     43G    99%    /news2/spool/news/21
/dev/da26      7.3T    6.7T     44G    99%    /news2/spool/news/22
/dev/da5       221G     36G    166G    18%    /news1
/dev/md0        40G     15G     20G    43%    /news3
| Incoming Feed (+ Top1000 #) | Accepted | %Acc | %Tot | Art/sec | Volume | %Vol | KB/art | Check | Ihave | Spam | TooOld | Rejs | Errs | ||
|---|---|---|---|---|---|---|---|---|---|---|---|---|---|---|---|
| 1 | feeder.ecngs.de | 45454729 | 88.78 | 99.52 | 526.10 | 30.36TB | 99.99 | 717.25 | 48537844 | 0 | 0 | 0 | 2662925 | 0 | |
| 2 | feeder2.ecngs.de | 219501 | 73.71 | 0.48 | 2.54 | 1.67GB | 0.01 | 7.95 | 296337 | 0 | 0 | 0 | 1450 | 0 | |
| Total | 45674230 | 0.00 | 100.00 | 528.64 | 30.36TB | 100.00 | 713.84 | 48834181 | 0 | 0 | 0 | 2664375 | 0 | ||
 |
| Incoming Feed (+ Top1000 #) | Volume | %Vol | Kbps | Accepted | %Acc | %Tot | KB/art | Check | Ihave | Spam | TooOld | Rejs | Errs | ||
|---|---|---|---|---|---|---|---|---|---|---|---|---|---|---|---|
| 1 | feeder.ecngs.de | 30.36TB | 99.99 | 3018729.58 | 45454729 | 88.78 | 99.52 | 717.25 | 48537844 | 0 | 0 | 0 | 2662925 | 0 | |
| 2 | feeder2.ecngs.de | 1.67GB | 0.01 | 161.67 | 219501 | 73.71 | 0.48 | 7.95 | 296337 | 0 | 0 | 0 | 1450 | 0 | |
| Total | 30.36TB | 100.00 | 3018891.25 | 45674230 | 0.00 | 100.00 | 713.84 | 48834181 | 0 | 0 | 0 | 2664375 | 0 | ||
 |
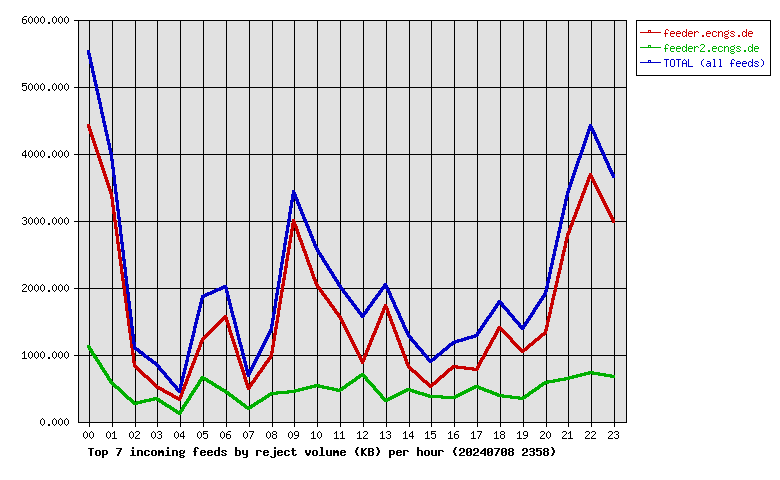
| Incoming Feed (+ Top1000 #) | Rej. Vol. | %Vol | Kbps | Accepted | %Acc | %Tot | KB/art | Check | Ihave | Spam | TooOld | Rejs | Errs | ||
|---|---|---|---|---|---|---|---|---|---|---|---|---|---|---|---|
| 1 | feeder.ecngs.de | 38.07MB | 77.19 | 3.61 | 45454729 | 88.78 | 99.52 | 717.25 | 48537844 | 0 | 0 | 0 | 2662925 | 0 | |
| 2 | feeder2.ecngs.de | 11.25MB | 22.81 | 1.07 | 219501 | 73.71 | 0.48 | 7.95 | 296337 | 0 | 0 | 0 | 1450 | 0 | |
| Total | 49.32MB | 100.00 | 4.68 | 45674230 | 0.00 | 100.00 | 713.84 | 48834181 | 0 | 0 | 0 | 2664375 | 0 | ||
 |
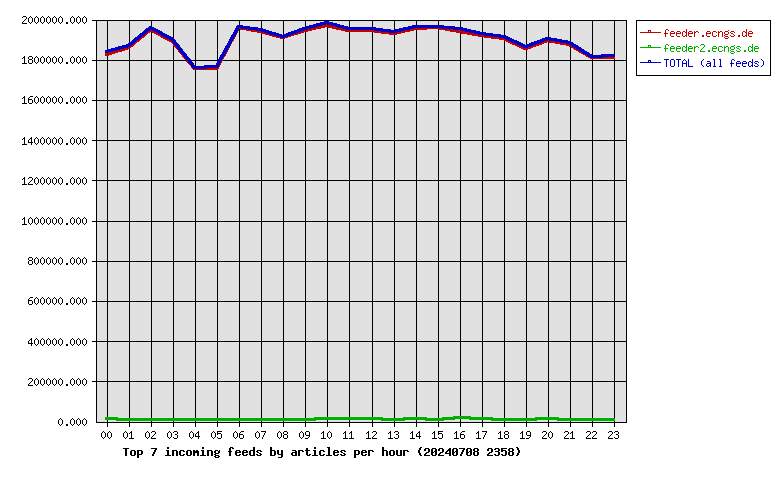
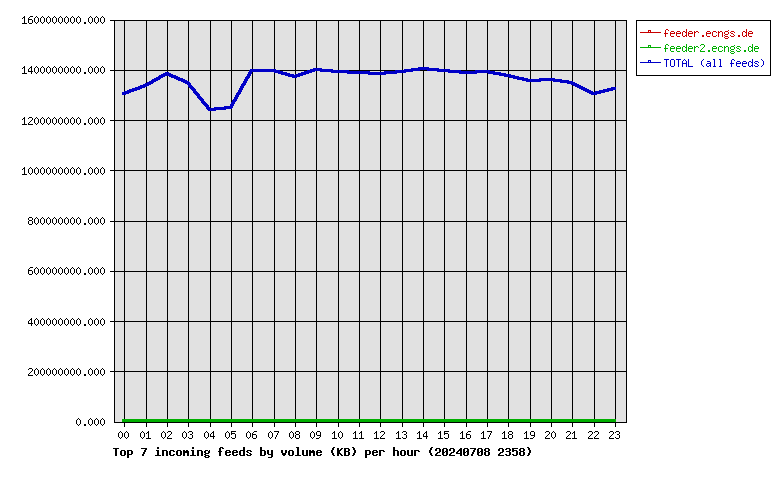
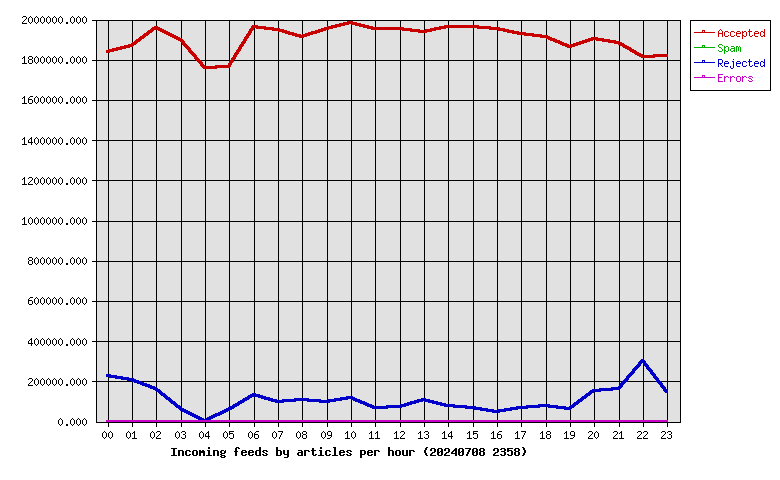
| Hour | Accepted | %Acc | Volume | %Vol | Check | Ihave | Spam | Rejs | Errs |
|---|---|---|---|---|---|---|---|---|---|
| 00 | 1837890 | 4.02 | 1.21TB | 3.99 | 2087555 | 0 | 0 | 225577 | 0 |
| 01 | 1869257 | 4.09 | 1.24TB | 4.09 | 2092855 | 0 | 0 | 206924 | 0 |
| 02 | 1955732 | 4.28 | 1.29TB | 4.24 | 2131007 | 0 | 0 | 163229 | 0 |
| 03 | 1896971 | 4.15 | 1.25TB | 4.13 | 1968377 | 0 | 0 | 59888 | 0 |
| 04 | 1760635 | 3.85 | 1.15TB | 3.80 | 1770612 | 0 | 0 | 43 | 0 |
| 05 | 1763171 | 3.86 | 1.16TB | 3.83 | 1963855 | 0 | 0 | 55273 | 0 |
| 06 | 1964417 | 4.30 | 1.30TB | 4.28 | 2108546 | 0 | 0 | 133799 | 0 |
| 07 | 1945598 | 4.26 | 1.30TB | 4.28 | 2052261 | 0 | 0 | 97700 | 0 |
| 08 | 1913673 | 4.19 | 1.28TB | 4.20 | 2030388 | 0 | 0 | 104965 | 0 |
| 09 | 1951542 | 4.27 | 1.30TB | 4.29 | 2065381 | 0 | 0 | 98635 | 0 |
| 10 | 1981103 | 4.34 | 1.30TB | 4.27 | 2118726 | 0 | 0 | 119009 | 0 |
| 11 | 1950798 | 4.27 | 1.29TB | 4.26 | 2036158 | 0 | 0 | 66782 | 0 |
| 12 | 1954281 | 4.28 | 1.29TB | 4.24 | 2043809 | 0 | 0 | 71899 | 0 |
| 13 | 1935871 | 4.24 | 1.30TB | 4.27 | 2057006 | 0 | 0 | 105976 | 0 |
| 14 | 1960961 | 4.29 | 1.31TB | 4.31 | 2057052 | 0 | 0 | 78990 | 0 |
| 15 | 1963703 | 4.30 | 1.30TB | 4.27 | 2041725 | 0 | 0 | 66281 | 0 |
| 16 | 1953089 | 4.28 | 1.29TB | 4.26 | 2024007 | 0 | 0 | 45821 | 0 |
| 17 | 1930258 | 4.23 | 1.30TB | 4.27 | 2019954 | 0 | 0 | 64988 | 0 |
| 18 | 1910475 | 4.18 | 1.28TB | 4.21 | 1999535 | 0 | 0 | 76581 | 0 |
| 19 | 1862504 | 4.08 | 1.26TB | 4.16 | 1939030 | 0 | 0 | 62652 | 0 |
| 20 | 1901452 | 4.16 | 1.26TB | 4.16 | 2068649 | 0 | 0 | 150648 | 0 |
| 21 | 1881045 | 4.12 | 1.26TB | 4.14 | 2060168 | 0 | 0 | 164090 | 0 |
| 22 | 1813020 | 3.97 | 1.21TB | 4.00 | 2124237 | 0 | 0 | 299485 | 0 |
| 23 | 1816784 | 3.98 | 1.23TB | 4.06 | 1973288 | 0 | 0 | 145140 | 0 |
| Total | 45674230 | 100.00 | 30.36TB | 100.00 | 48834181 | 0 | 0 | 2664375 | 0 |
 |
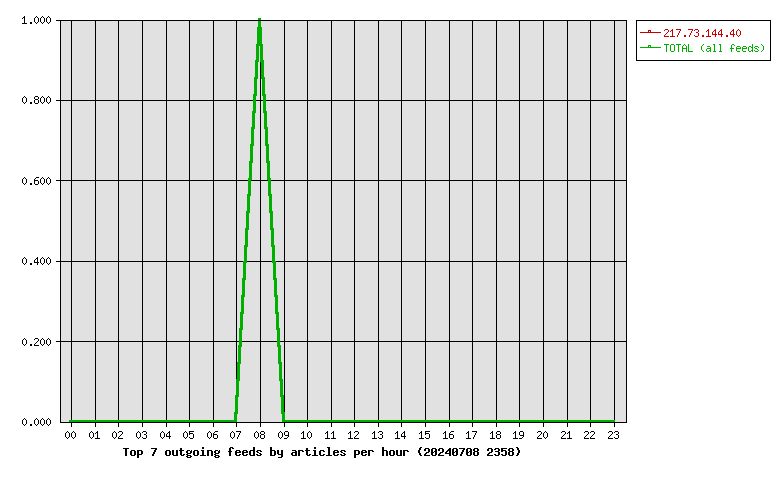
| Outgoing Feed (+ Top1000 #) | Accepted | %Acc | %Tot | Art/sec | Volume | %Vol | KB/art | Dups | Rejs | % Ratio (Out/In) | ||
|---|---|---|---|---|---|---|---|---|---|---|---|---|
| 1 | 217.73.144.40 | 1 | 0.00 | 100.00 | 0.00 | 0.65KB | 100.00 | 0.65 | 45675558 | 0 | … | |
| Total | 1 | 0.00 | 100.00 | 0.00 | 0.65KB | 100.00 | 0.65 | 45675558 | 0 | 0.00 | ||
 |
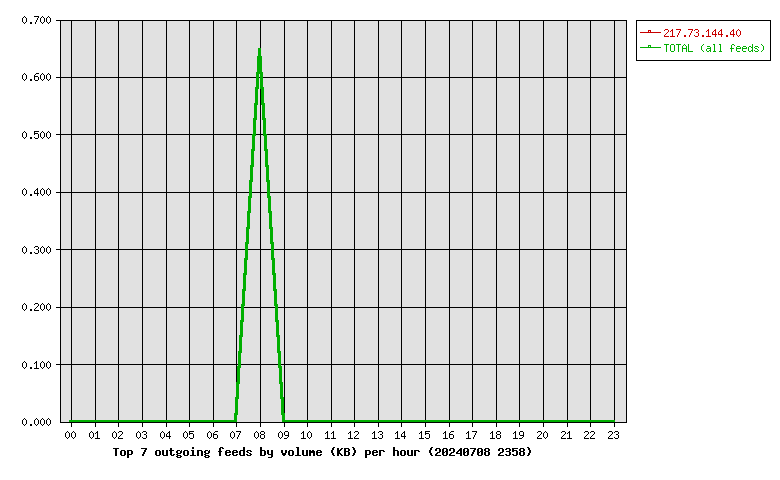
| Outgoing Feed (+ Top1000 #) | Volume | %Vol | Kbps | Accepted | %Acc | %Tot | KB/art | Dups | Rejs | % Ratio (Out/In) | ||
|---|---|---|---|---|---|---|---|---|---|---|---|---|
| 1 | 217.73.144.40 | 0.65KB | 100.00 | 0.00 | 1 | 0.00 | 100.00 | 0.65 | 45675558 | 0 | … | |
| Total | 0.65KB | 100.00 | 0.00 | 1 | 0.00 | 100.00 | 0.65 | 45675558 | 0 | 0.00 | ||
 |
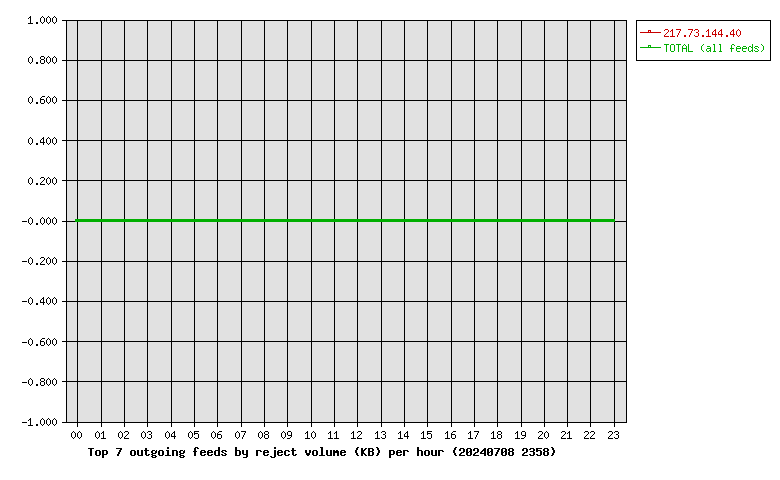
| Outgoing Feed (+ Top1000 #) | Rej. Vol. | %Vol | Kbps | Accepted | %Acc | %Tot | KB/art | Dups | Rejs | % Ratio (Out/In) | ||
|---|---|---|---|---|---|---|---|---|---|---|---|---|
| 1 | 217.73.144.40 | 0.00KB | 0.00 | 0.00 | 1 | 0.00 | 100.00 | 0.65 | 45675558 | 0 | … | |
| Total | 0.00KB | 0.00 | 0.00 | 1 | 0.00 | 100.00 | 0.65 | 45675558 | 0 | 0.00 | ||
 |
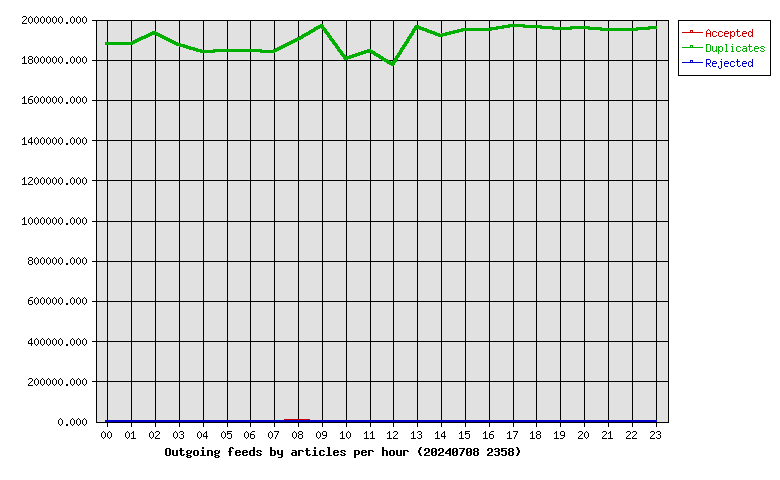
| Hour | Accepted | %Acc | Volume | %Vol | dups | Rejs |
|---|---|---|---|---|---|---|
| 00 | 0 | 0.00 | 0.00KB | 0.00 | 1876114 | 0 |
| 01 | 0 | 0.00 | 0.00KB | 0.00 | 1880141 | 0 |
| 02 | 0 | 0.00 | 0.00KB | 0.00 | 1931318 | 0 |
| 03 | 0 | 0.00 | 0.00KB | 0.00 | 1870788 | 0 |
| 04 | 0 | 0.00 | 0.00KB | 0.00 | 1840751 | 0 |
| 05 | 0 | 0.00 | 0.00KB | 0.00 | 1844568 | 0 |
| 06 | 0 | 0.00 | 0.00KB | 0.00 | 1841745 | 0 |
| 07 | 0 | 0.00 | 0.00KB | 0.00 | 1838677 | 0 |
| 08 | 1 | 100.00 | 0.65KB | 100.00 | 1899445 | 0 |
| 09 | 0 | 0.00 | 0.00KB | 0.00 | 1966408 | 0 |
| 10 | 0 | 0.00 | 0.00KB | 0.00 | 1803122 | 0 |
| 11 | 0 | 0.00 | 0.00KB | 0.00 | 1843178 | 0 |
| 12 | 0 | 0.00 | 0.00KB | 0.00 | 1772327 | 0 |
| 13 | 0 | 0.00 | 0.00KB | 0.00 | 1964179 | 0 |
| 14 | 0 | 0.00 | 0.00KB | 0.00 | 1917330 | 0 |
| 15 | 0 | 0.00 | 0.00KB | 0.00 | 1949310 | 0 |
| 16 | 0 | 0.00 | 0.00KB | 0.00 | 1946093 | 0 |
| 17 | 0 | 0.00 | 0.00KB | 0.00 | 1965715 | 0 |
| 18 | 0 | 0.00 | 0.00KB | 0.00 | 1961163 | 0 |
| 19 | 0 | 0.00 | 0.00KB | 0.00 | 1951325 | 0 |
| 20 | 0 | 0.00 | 0.00KB | 0.00 | 1956493 | 0 |
| 21 | 0 | 0.00 | 0.00KB | 0.00 | 1947513 | 0 |
| 22 | 0 | 0.00 | 0.00KB | 0.00 | 1949877 | 0 |
| 23 | 0 | 0.00 | 0.00KB | 0.00 | 1957978 | 0 |
| Total | 1 | 100.00 | 0.65KB | 100.00 | 45675558 | 0 |
 |
| >= 20% Full | >= 35% Full | >= 50% Full | >= 65% Full | >= 80% Full | >= 95% Full |
| Outgoing Feed | Batch Seq | Batch Num | Batch Max | %Full | Av. Pending |
|---|---|---|---|---|---|
| nbr.elbracht.net-o | 967328-967409 | 81 | 500 | 16 | 0.0 |
| text-spool-out | 0-0 | 0 | 500 | 0 | 0.0 |
| 1st Time | Last Time | # Msgs | Message |
|---|