| |
DIABLO statistics for newsfeed.yoursite.com on Sun 07 Jul 2024 |
Generated on 20240707 2358 by feeder-stats v4.006. Copyright © 2002 The Diablo Project.
Diablo running processes:  88    Dnewslink running processes:  1


12:00AM  up 140 days,  7:19, 0 users, load averages: 9.80, 10.04, 10.10

Filesystem     Size    Used   Avail Capacity  Mounted on
/dev/da0s1g     94G    2.1G     84G     2%    /news
/dev/da1       7.3T    6.7T     48G    99%    /news2/spool/news/00
/dev/da2       7.3T    6.7T     52G    99%    /news2/spool/news/01
/dev/da3       3.7T    3.3T     65G    98%    /news2/spool/news/02
/dev/da4       5.5T      5T     62G    99%    /news2/spool/news/03
/dev/da8       7.3T    6.6T     61G    99%    /news2/spool/news/04
/dev/da9       7.3T    6.6T     60G    99%    /news2/spool/news/05
/dev/da10      7.3T    6.7T     48G    99%    /news2/spool/news/06
/dev/da11      5.5T      5T     83G    98%    /news2/spool/news/07
/dev/da12      5.5T      5T     78G    98%    /news2/spool/news/08
/dev/da13      7.3T    6.6T     60G    99%    /news2/spool/news/09
/dev/da14      7.3T    6.7T     55G    99%    /news2/spool/news/10
/dev/da15      7.3T    6.7T     51G    99%    /news2/spool/news/11
/dev/da16      7.3T    6.7T     56G    99%    /news2/spool/news/12
/dev/da17      7.3T    6.7T     50G    99%    /news2/spool/news/13
/dev/da18      7.3T    6.6T     61G    99%    /news2/spool/news/14
/dev/da19      7.3T    6.6T     58G    99%    /news2/spool/news/15
/dev/da20      7.3T    6.7T     52G    99%    /news2/spool/news/16
/dev/da21      7.3T    6.7T     54G    99%    /news2/spool/news/17
/dev/da22      7.3T    6.7T     52G    99%    /news2/spool/news/18
/dev/da23      7.3T    6.6T     59G    99%    /news2/spool/news/19
/dev/da24      7.3T    6.6T     59G    99%    /news2/spool/news/20
/dev/da25      7.3T    6.7T     50G    99%    /news2/spool/news/21
/dev/da26      7.3T    6.7T     51G    99%    /news2/spool/news/22
/dev/da5       221G     36G    167G    18%    /news1
/dev/md0        40G     15G     20G    43%    /news3
| Incoming Feed (+ Top1000 #) | Accepted | %Acc | %Tot | Art/sec | Volume | %Vol | KB/art | Check | Ihave | Spam | TooOld | Rejs | Errs | ||
|---|---|---|---|---|---|---|---|---|---|---|---|---|---|---|---|
| 1 | feeder.ecngs.de | 45020063 | 86.16 | 99.37 | 521.07 | 30.29TB | 99.99 | 722.34 | 48885222 | 0 | 0 | 0 | 3367756 | 0 | |
| 2 | feeder2.ecngs.de | 286533 | 73.20 | 0.63 | 3.32 | 2.15GB | 0.01 | 7.86 | 389516 | 0 | 0 | 0 | 1925 | 0 | |
| Total | 45306596 | 0.00 | 100.00 | 524.38 | 30.29TB | 100.00 | 717.82 | 49274738 | 0 | 0 | 0 | 3369681 | 0 | ||
 |
| Incoming Feed (+ Top1000 #) | Volume | %Vol | Kbps | Accepted | %Acc | %Tot | KB/art | Check | Ihave | Spam | TooOld | Rejs | Errs | ||
|---|---|---|---|---|---|---|---|---|---|---|---|---|---|---|---|
| 1 | feeder.ecngs.de | 30.29TB | 99.99 | 3011082.12 | 45020063 | 86.16 | 99.37 | 722.34 | 48885222 | 0 | 0 | 0 | 3367756 | 0 | |
| 2 | feeder2.ecngs.de | 2.15GB | 0.01 | 208.68 | 286533 | 73.20 | 0.63 | 7.86 | 389516 | 0 | 0 | 0 | 1925 | 0 | |
| Total | 30.29TB | 100.00 | 3011290.80 | 45306596 | 0.00 | 100.00 | 717.82 | 49274738 | 0 | 0 | 0 | 3369681 | 0 | ||
 |
| Incoming Feed (+ Top1000 #) | Rej. Vol. | %Vol | Kbps | Accepted | %Acc | %Tot | KB/art | Check | Ihave | Spam | TooOld | Rejs | Errs | ||
|---|---|---|---|---|---|---|---|---|---|---|---|---|---|---|---|
| 1 | feeder.ecngs.de | 57.16MB | 79.54 | 5.42 | 45020063 | 86.16 | 99.37 | 722.34 | 48885222 | 0 | 0 | 0 | 3367756 | 0 | |
| 2 | feeder2.ecngs.de | 14.71MB | 20.46 | 1.40 | 286533 | 73.20 | 0.63 | 7.86 | 389516 | 0 | 0 | 0 | 1925 | 0 | |
| Total | 71.86MB | 100.00 | 6.81 | 45306596 | 0.00 | 100.00 | 717.82 | 49274738 | 0 | 0 | 0 | 3369681 | 0 | ||
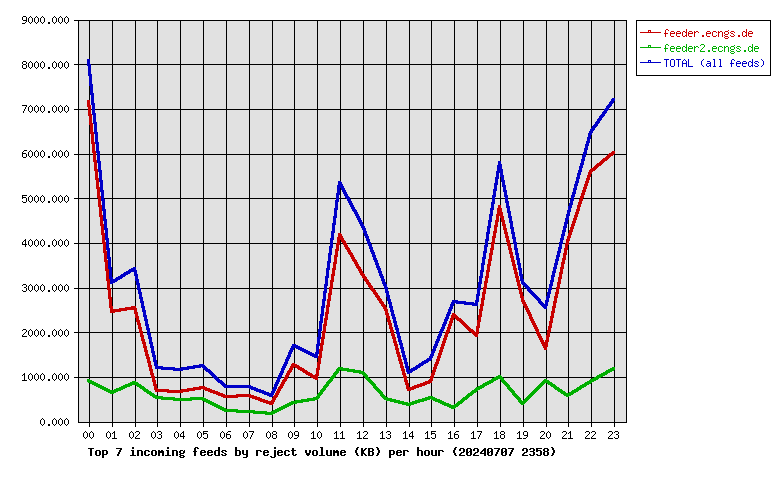 |
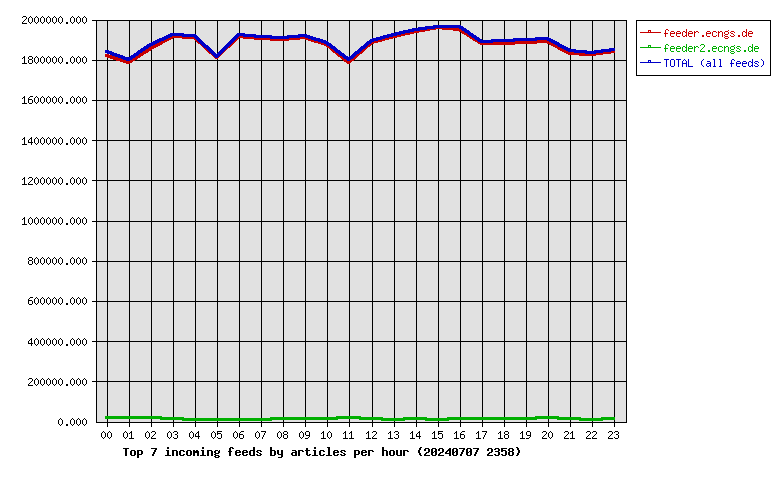
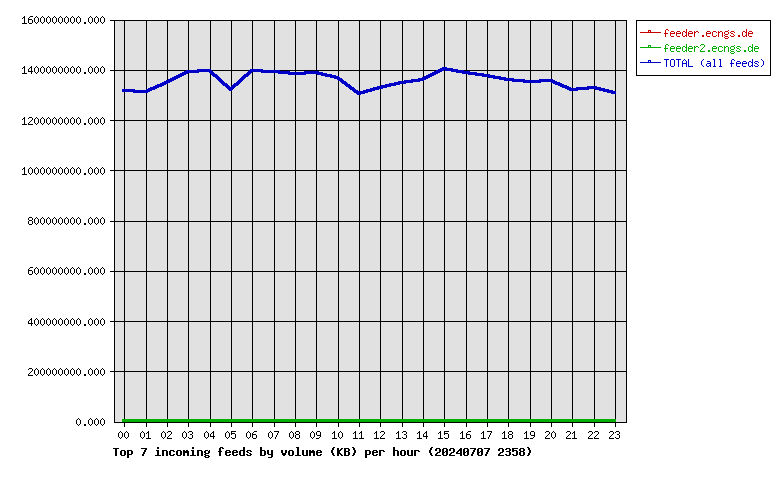
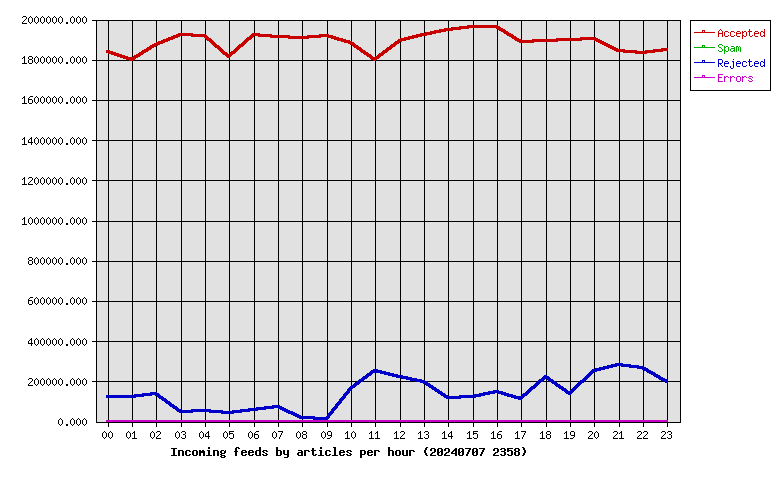
| Hour | Accepted | %Acc | Volume | %Vol | Check | Ihave | Spam | Rejs | Errs |
|---|---|---|---|---|---|---|---|---|---|
| 00 | 1837833 | 4.06 | 1.23TB | 4.05 | 1993280 | 0 | 0 | 123741 | 0 |
| 01 | 1800727 | 3.97 | 1.22TB | 4.03 | 1955959 | 0 | 0 | 123894 | 0 |
| 02 | 1872057 | 4.13 | 1.26TB | 4.15 | 2039483 | 0 | 0 | 139125 | 0 |
| 03 | 1924875 | 4.25 | 1.29TB | 4.27 | 1995405 | 0 | 0 | 49348 | 0 |
| 04 | 1916603 | 4.23 | 1.30TB | 4.29 | 1980763 | 0 | 0 | 50854 | 0 |
| 05 | 1813249 | 4.00 | 1.23TB | 4.05 | 1967165 | 0 | 0 | 40123 | 0 |
| 06 | 1920427 | 4.24 | 1.30TB | 4.28 | 1994003 | 0 | 0 | 58652 | 0 |
| 07 | 1914705 | 4.23 | 1.29TB | 4.27 | 1999341 | 0 | 0 | 69719 | 0 |
| 08 | 1907061 | 4.21 | 1.29TB | 4.25 | 1942510 | 0 | 0 | 19157 | 0 |
| 09 | 1920200 | 4.24 | 1.29TB | 4.27 | 1950985 | 0 | 0 | 14290 | 0 |
| 10 | 1884869 | 4.16 | 1.27TB | 4.20 | 2065476 | 0 | 0 | 159334 | 0 |
| 11 | 1797027 | 3.97 | 1.22TB | 4.01 | 2075443 | 0 | 0 | 251701 | 0 |
| 12 | 1894036 | 4.18 | 1.24TB | 4.08 | 2136085 | 0 | 0 | 222568 | 0 |
| 13 | 1922085 | 4.24 | 1.26TB | 4.14 | 2132652 | 0 | 0 | 196551 | 0 |
| 14 | 1949648 | 4.30 | 1.26TB | 4.18 | 2086832 | 0 | 0 | 116407 | 0 |
| 15 | 1962229 | 4.33 | 1.31TB | 4.31 | 2094268 | 0 | 0 | 122139 | 0 |
| 16 | 1960344 | 4.33 | 1.29TB | 4.27 | 2125247 | 0 | 0 | 146679 | 0 |
| 17 | 1890460 | 4.17 | 1.28TB | 4.23 | 2021299 | 0 | 0 | 110821 | 0 |
| 18 | 1891380 | 4.17 | 1.26TB | 4.17 | 2133822 | 0 | 0 | 220202 | 0 |
| 19 | 1899129 | 4.19 | 1.26TB | 4.15 | 2076148 | 0 | 0 | 138424 | 0 |
| 20 | 1904445 | 4.20 | 1.26TB | 4.17 | 2182813 | 0 | 0 | 250559 | 0 |
| 21 | 1841810 | 4.07 | 1.23TB | 4.06 | 2144610 | 0 | 0 | 283284 | 0 |
| 22 | 1834128 | 4.05 | 1.24TB | 4.08 | 2116035 | 0 | 0 | 263935 | 0 |
| 23 | 1847269 | 4.08 | 1.22TB | 4.02 | 2065114 | 0 | 0 | 198174 | 0 |
| Total | 45306596 | 100.00 | 30.29TB | 100.00 | 49274738 | 0 | 0 | 3369681 | 0 |
 |
| Outgoing Feed (+ Top1000 #) | Accepted | %Acc | %Tot | Art/sec | Volume | %Vol | KB/art | Dups | Rejs | % Ratio (Out/In) | ||
|---|---|---|---|---|---|---|---|---|---|---|---|---|
| 1 | 217.73.144.40 | 0 | 0.00 | 0.00 | 0.00 | 0.00KB | 0.00 | 0.00 | 44968461 | 0 | … | |
| Total | 0 | 0.00 | 0.00 | 0.00 | 0.00KB | 0.00 | 0.00 | 44968461 | 0 | |||
 |
| Outgoing Feed (+ Top1000 #) | Volume | %Vol | Kbps | Accepted | %Acc | %Tot | KB/art | Dups | Rejs | % Ratio (Out/In) | ||
|---|---|---|---|---|---|---|---|---|---|---|---|---|
| 1 | 217.73.144.40 | 0.00KB | 0.00 | 0.00 | 0 | 0.00 | 0.00 | 0.00 | 44968461 | 0 | … | |
| Total | 0.00KB | 0.00 | 0.00 | 0 | 0.00 | 0.00 | 0.00 | 44968461 | 0 | |||
 |
| Outgoing Feed (+ Top1000 #) | Rej. Vol. | %Vol | Kbps | Accepted | %Acc | %Tot | KB/art | Dups | Rejs | % Ratio (Out/In) | ||
|---|---|---|---|---|---|---|---|---|---|---|---|---|
| 1 | 217.73.144.40 | 0.00KB | 0.00 | 0.00 | 0 | 0.00 | 0.00 | 0.00 | 44968461 | 0 | … | |
| Total | 0.00KB | 0.00 | 0.00 | 0 | 0.00 | 0.00 | 0.00 | 44968461 | 0 | |||
 |
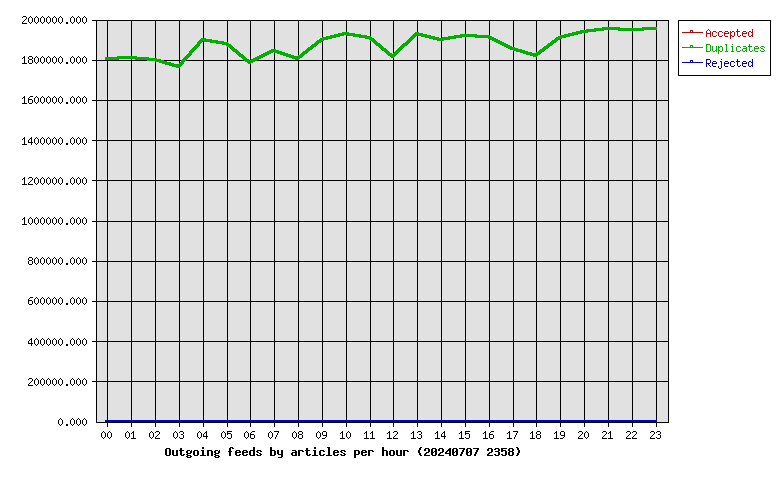
| Hour | Accepted | %Acc | Volume | %Vol | dups | Rejs |
|---|---|---|---|---|---|---|
| 00 | 0 | 0.00 | 0.00KB | 0.00 | 1805590 | 0 |
| 01 | 0 | 0.00 | 0.00KB | 0.00 | 1810831 | 0 |
| 02 | 0 | 0.00 | 0.00KB | 0.00 | 1800928 | 0 |
| 03 | 0 | 0.00 | 0.00KB | 0.00 | 1763968 | 0 |
| 04 | 0 | 0.00 | 0.00KB | 0.00 | 1900340 | 0 |
| 05 | 0 | 0.00 | 0.00KB | 0.00 | 1877288 | 0 |
| 06 | 0 | 0.00 | 0.00KB | 0.00 | 1782740 | 0 |
| 07 | 0 | 0.00 | 0.00KB | 0.00 | 1841056 | 0 |
| 08 | 0 | 0.00 | 0.00KB | 0.00 | 1804079 | 0 |
| 09 | 0 | 0.00 | 0.00KB | 0.00 | 1900135 | 0 |
| 10 | 0 | 0.00 | 0.00KB | 0.00 | 1928402 | 0 |
| 11 | 0 | 0.00 | 0.00KB | 0.00 | 1908968 | 0 |
| 12 | 0 | 0.00 | 0.00KB | 0.00 | 1811747 | 0 |
| 13 | 0 | 0.00 | 0.00KB | 0.00 | 1926790 | 0 |
| 14 | 0 | 0.00 | 0.00KB | 0.00 | 1898430 | 0 |
| 15 | 0 | 0.00 | 0.00KB | 0.00 | 1916336 | 0 |
| 16 | 0 | 0.00 | 0.00KB | 0.00 | 1914529 | 0 |
| 17 | 0 | 0.00 | 0.00KB | 0.00 | 1851776 | 0 |
| 18 | 0 | 0.00 | 0.00KB | 0.00 | 1820532 | 0 |
| 19 | 0 | 0.00 | 0.00KB | 0.00 | 1910092 | 0 |
| 20 | 0 | 0.00 | 0.00KB | 0.00 | 1936174 | 0 |
| 21 | 0 | 0.00 | 0.00KB | 0.00 | 1954575 | 0 |
| 22 | 0 | 0.00 | 0.00KB | 0.00 | 1948826 | 0 |
| 23 | 0 | 0.00 | 0.00KB | 0.00 | 1954329 | 0 |
| Total | 0 | 0.00 | 0.00KB | 0.00 | 44968461 | 0 |
 |
| >= 20% Full | >= 35% Full | >= 50% Full | >= 65% Full | >= 80% Full | >= 95% Full |
| Outgoing Feed | Batch Seq | Batch Num | Batch Max | %Full | Av. Pending |
|---|---|---|---|---|---|
| nbr.elbracht.net-o | 967040-967121 | 81 | 500 | 16 | 0.0 |
| text-spool-out | 0-0 | 0 | 500 | 0 | 0.0 |
| 1st Time | Last Time | # Msgs | Message |
|---|