| |
DIABLO statistics for newsfeed.yoursite.com on Sat 06 Jul 2024 |
Generated on 20240706 2358 by feeder-stats v4.006. Copyright © 2002 The Diablo Project.
Diablo running processes:  91    Dnewslink running processes:  0


12:00AM  up 139 days,  7:19, 0 users, load averages: 13.69, 11.20, 10.60

Filesystem     Size    Used   Avail Capacity  Mounted on
/dev/da0s1g     94G    2.0G     84G     2%    /news
/dev/da1       7.3T    6.7T     55G    99%    /news2/spool/news/00
/dev/da2       7.3T    6.7T     54G    99%    /news2/spool/news/01
/dev/da3       3.7T    3.3T     56G    98%    /news2/spool/news/02
/dev/da4       5.5T      5T     74G    99%    /news2/spool/news/03
/dev/da8       7.3T    6.6T     61G    99%    /news2/spool/news/04
/dev/da9       7.3T    6.6T     59G    99%    /news2/spool/news/05
/dev/da10      7.3T    6.7T     53G    99%    /news2/spool/news/06
/dev/da11      5.5T      5T     72G    99%    /news2/spool/news/07
/dev/da12      5.5T      5T     81G    98%    /news2/spool/news/08
/dev/da13      7.3T    6.6T     64G    99%    /news2/spool/news/09
/dev/da14      7.3T    6.7T     56G    99%    /news2/spool/news/10
/dev/da15      7.3T    6.7T     56G    99%    /news2/spool/news/11
/dev/da16      7.3T    6.6T     59G    99%    /news2/spool/news/12
/dev/da17      7.3T    6.7T     54G    99%    /news2/spool/news/13
/dev/da18      7.3T    6.6T     65G    99%    /news2/spool/news/14
/dev/da19      7.3T    6.6T     57G    99%    /news2/spool/news/15
/dev/da20      7.3T    6.6T     58G    99%    /news2/spool/news/16
/dev/da21      7.3T    6.7T     55G    99%    /news2/spool/news/17
/dev/da22      7.3T    6.7T     54G    99%    /news2/spool/news/18
/dev/da23      7.3T    6.6T     60G    99%    /news2/spool/news/19
/dev/da24      7.3T    6.6T     58G    99%    /news2/spool/news/20
/dev/da25      7.3T    6.7T     55G    99%    /news2/spool/news/21
/dev/da26      7.3T    6.7T     53G    99%    /news2/spool/news/22
/dev/da5       221G     36G    167G    18%    /news1
/dev/md0        40G     15G     20G    43%    /news3
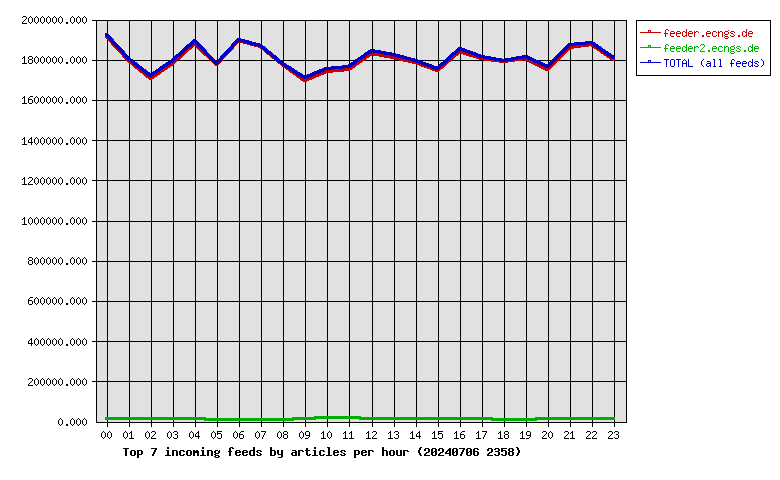
| Incoming Feed (+ Top1000 #) | Accepted | %Acc | %Tot | Art/sec | Volume | %Vol | KB/art | Check | Ihave | Spam | TooOld | Rejs | Errs | ||
|---|---|---|---|---|---|---|---|---|---|---|---|---|---|---|---|
| 1 | feeder.ecngs.de | 43229976 | 83.69 | 99.39 | 500.35 | 29.11TB | 99.99 | 723.15 | 47657850 | 0 | 0 | 0 | 3994613 | 0 | |
| 2 | feeder2.ecngs.de | 266965 | 70.91 | 0.61 | 3.10 | 1.74GB | 0.01 | 6.82 | 374535 | 0 | 0 | 0 | 1959 | 0 | |
| Total | 43496941 | 0.00 | 100.00 | 503.45 | 29.12TB | 100.00 | 718.75 | 48032385 | 0 | 0 | 0 | 3996572 | 0 | ||
 |
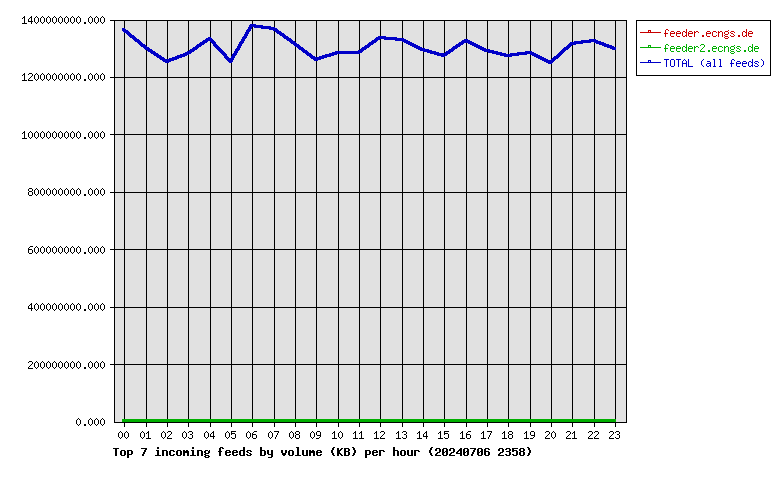
| Incoming Feed (+ Top1000 #) | Volume | %Vol | Kbps | Accepted | %Acc | %Tot | KB/art | Check | Ihave | Spam | TooOld | Rejs | Errs | ||
|---|---|---|---|---|---|---|---|---|---|---|---|---|---|---|---|
| 1 | feeder.ecngs.de | 29.11TB | 99.99 | 2894611.19 | 43229976 | 83.69 | 99.39 | 723.15 | 47657850 | 0 | 0 | 0 | 3994613 | 0 | |
| 2 | feeder2.ecngs.de | 1.74GB | 0.01 | 169.27 | 266965 | 70.91 | 0.61 | 6.82 | 374535 | 0 | 0 | 0 | 1959 | 0 | |
| Total | 29.12TB | 100.00 | 2894780.46 | 43496941 | 0.00 | 100.00 | 718.75 | 48032385 | 0 | 0 | 0 | 3996572 | 0 | ||
 |
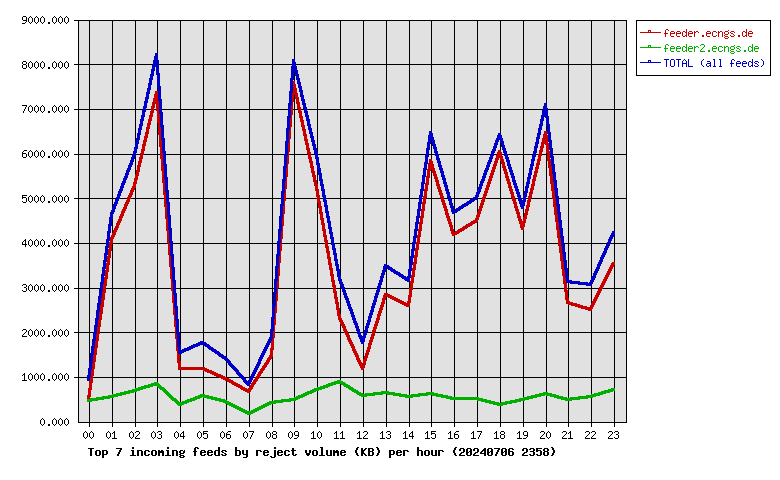
| Incoming Feed (+ Top1000 #) | Rej. Vol. | %Vol | Kbps | Accepted | %Acc | %Tot | KB/art | Check | Ihave | Spam | TooOld | Rejs | Errs | ||
|---|---|---|---|---|---|---|---|---|---|---|---|---|---|---|---|
| 1 | feeder.ecngs.de | 82.33MB | 86.48 | 7.81 | 43229976 | 83.69 | 99.39 | 723.15 | 47657850 | 0 | 0 | 0 | 3994613 | 0 | |
| 2 | feeder2.ecngs.de | 12.88MB | 13.52 | 1.23 | 266965 | 70.91 | 0.61 | 6.82 | 374535 | 0 | 0 | 0 | 1959 | 0 | |
| Total | 95.21MB | 100.00 | 9.03 | 43496941 | 0.00 | 100.00 | 718.75 | 48032385 | 0 | 0 | 0 | 3996572 | 0 | ||
 |
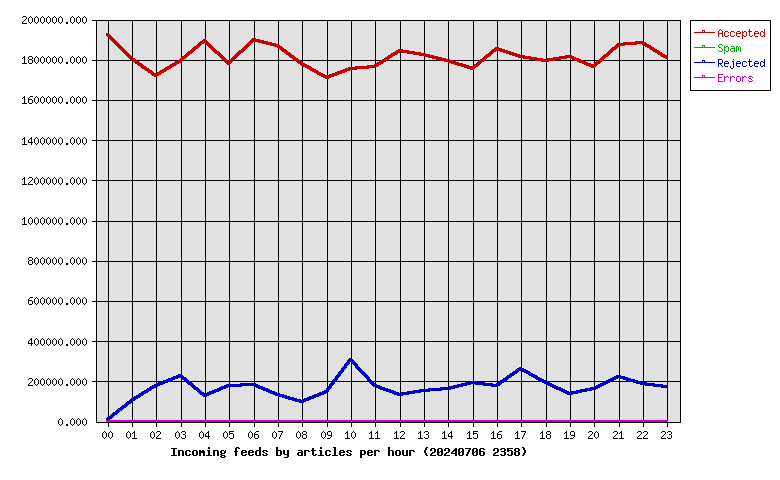
| Hour | Accepted | %Acc | Volume | %Vol | Check | Ihave | Spam | Rejs | Errs |
|---|---|---|---|---|---|---|---|---|---|
| 00 | 1924532 | 4.42 | 1.27TB | 4.36 | 1950266 | 0 | 0 | 9108 | 0 |
| 01 | 1804582 | 4.15 | 1.21TB | 4.17 | 1925457 | 0 | 0 | 102888 | 0 |
| 02 | 1718218 | 3.95 | 1.17TB | 4.01 | 1920371 | 0 | 0 | 178949 | 0 |
| 03 | 1792035 | 4.12 | 1.19TB | 4.09 | 2040252 | 0 | 0 | 224304 | 0 |
| 04 | 1890915 | 4.35 | 1.24TB | 4.26 | 2037483 | 0 | 0 | 126639 | 0 |
| 05 | 1780816 | 4.09 | 1.17TB | 4.01 | 2045434 | 0 | 0 | 177909 | 0 |
| 06 | 1900448 | 4.37 | 1.28TB | 4.41 | 2092942 | 0 | 0 | 183934 | 0 |
| 07 | 1869624 | 4.30 | 1.27TB | 4.37 | 2010493 | 0 | 0 | 130880 | 0 |
| 08 | 1779661 | 4.09 | 1.22TB | 4.20 | 1888381 | 0 | 0 | 96748 | 0 |
| 09 | 1707349 | 3.93 | 1.17TB | 4.03 | 1876507 | 0 | 0 | 148386 | 0 |
| 10 | 1753641 | 4.03 | 1.20TB | 4.11 | 2087845 | 0 | 0 | 306752 | 0 |
| 11 | 1763977 | 4.06 | 1.19TB | 4.10 | 1970087 | 0 | 0 | 176006 | 0 |
| 12 | 1842219 | 4.24 | 1.24TB | 4.27 | 1998298 | 0 | 0 | 132081 | 0 |
| 13 | 1822675 | 4.19 | 1.24TB | 4.25 | 1994359 | 0 | 0 | 151619 | 0 |
| 14 | 1792764 | 4.12 | 1.21TB | 4.14 | 1975928 | 0 | 0 | 163874 | 0 |
| 15 | 1753257 | 4.03 | 1.18TB | 4.07 | 1963120 | 0 | 0 | 189179 | 0 |
| 16 | 1853372 | 4.26 | 1.23TB | 4.24 | 2049972 | 0 | 0 | 175357 | 0 |
| 17 | 1812802 | 4.17 | 1.20TB | 4.13 | 2092114 | 0 | 0 | 260280 | 0 |
| 18 | 1793980 | 4.12 | 1.19TB | 4.08 | 1997269 | 0 | 0 | 189725 | 0 |
| 19 | 1812542 | 4.17 | 1.19TB | 4.10 | 1963035 | 0 | 0 | 135646 | 0 |
| 20 | 1761387 | 4.05 | 1.16TB | 3.99 | 1941986 | 0 | 0 | 159767 | 0 |
| 21 | 1872828 | 4.31 | 1.23TB | 4.21 | 2117847 | 0 | 0 | 222505 | 0 |
| 22 | 1884024 | 4.33 | 1.23TB | 4.24 | 2094200 | 0 | 0 | 184614 | 0 |
| 23 | 1809293 | 4.16 | 1.21TB | 4.15 | 1998739 | 0 | 0 | 169422 | 0 |
| Total | 43496941 | 100.00 | 29.12TB | 100.00 | 48032385 | 0 | 0 | 3996572 | 0 |
 |
| Outgoing Feed (+ Top1000 #) | Accepted | %Acc | %Tot | Art/sec | Volume | %Vol | KB/art | Dups | Rejs | % Ratio (Out/In) | ||
|---|---|---|---|---|---|---|---|---|---|---|---|---|
| 1 | 217.73.144.40 | 0 | 0.00 | 0.00 | 0.00 | 0.00KB | 0.00 | 0.00 | 42045118 | 0 | … | |
| Total | 0 | 0.00 | 0.00 | 0.00 | 0.00KB | 0.00 | 0.00 | 42045118 | 0 | |||
 |
| Outgoing Feed (+ Top1000 #) | Volume | %Vol | Kbps | Accepted | %Acc | %Tot | KB/art | Dups | Rejs | % Ratio (Out/In) | ||
|---|---|---|---|---|---|---|---|---|---|---|---|---|
| 1 | 217.73.144.40 | 0.00KB | 0.00 | 0.00 | 0 | 0.00 | 0.00 | 0.00 | 42045118 | 0 | … | |
| Total | 0.00KB | 0.00 | 0.00 | 0 | 0.00 | 0.00 | 0.00 | 42045118 | 0 | |||
 |
| Outgoing Feed (+ Top1000 #) | Rej. Vol. | %Vol | Kbps | Accepted | %Acc | %Tot | KB/art | Dups | Rejs | % Ratio (Out/In) | ||
|---|---|---|---|---|---|---|---|---|---|---|---|---|
| 1 | 217.73.144.40 | 0.00KB | 0.00 | 0.00 | 0 | 0.00 | 0.00 | 0.00 | 42045118 | 0 | … | |
| Total | 0.00KB | 0.00 | 0.00 | 0 | 0.00 | 0.00 | 0.00 | 42045118 | 0 | |||
 |
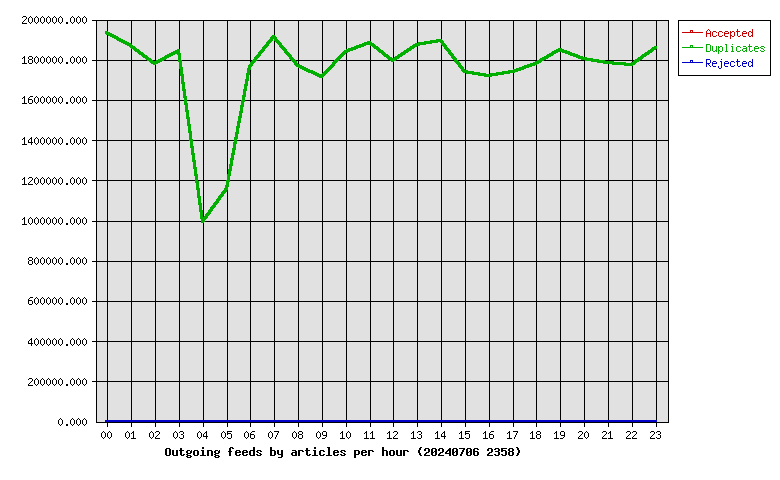
| Hour | Accepted | %Acc | Volume | %Vol | dups | Rejs |
|---|---|---|---|---|---|---|
| 00 | 0 | 0.00 | 0.00KB | 0.00 | 1933076 | 0 |
| 01 | 0 | 0.00 | 0.00KB | 0.00 | 1869360 | 0 |
| 02 | 0 | 0.00 | 0.00KB | 0.00 | 1779843 | 0 |
| 03 | 0 | 0.00 | 0.00KB | 0.00 | 1840818 | 0 |
| 04 | 0 | 0.00 | 0.00KB | 0.00 | 990099 | 0 |
| 05 | 0 | 0.00 | 0.00KB | 0.00 | 1157116 | 0 |
| 06 | 0 | 0.00 | 0.00KB | 0.00 | 1762946 | 0 |
| 07 | 0 | 0.00 | 0.00KB | 0.00 | 1911039 | 0 |
| 08 | 0 | 0.00 | 0.00KB | 0.00 | 1771030 | 0 |
| 09 | 0 | 0.00 | 0.00KB | 0.00 | 1715613 | 0 |
| 10 | 0 | 0.00 | 0.00KB | 0.00 | 1835882 | 0 |
| 11 | 0 | 0.00 | 0.00KB | 0.00 | 1884559 | 0 |
| 12 | 0 | 0.00 | 0.00KB | 0.00 | 1792366 | 0 |
| 13 | 0 | 0.00 | 0.00KB | 0.00 | 1870996 | 0 |
| 14 | 0 | 0.00 | 0.00KB | 0.00 | 1892139 | 0 |
| 15 | 0 | 0.00 | 0.00KB | 0.00 | 1737925 | 0 |
| 16 | 0 | 0.00 | 0.00KB | 0.00 | 1716574 | 0 |
| 17 | 0 | 0.00 | 0.00KB | 0.00 | 1739002 | 0 |
| 18 | 0 | 0.00 | 0.00KB | 0.00 | 1779458 | 0 |
| 19 | 0 | 0.00 | 0.00KB | 0.00 | 1847762 | 0 |
| 20 | 0 | 0.00 | 0.00KB | 0.00 | 1804241 | 0 |
| 21 | 0 | 0.00 | 0.00KB | 0.00 | 1784847 | 0 |
| 22 | 0 | 0.00 | 0.00KB | 0.00 | 1771838 | 0 |
| 23 | 0 | 0.00 | 0.00KB | 0.00 | 1856589 | 0 |
| Total | 0 | 0.00 | 0.00KB | 0.00 | 42045118 | 0 |
 |
| >= 20% Full | >= 35% Full | >= 50% Full | >= 65% Full | >= 80% Full | >= 95% Full |
| Outgoing Feed | Batch Seq | Batch Num | Batch Max | %Full | Av. Pending |
|---|---|---|---|---|---|
| nbr.elbracht.net-o | 966752-966833 | 81 | 500 | 16 | 0.0 |
| text-spool-out | 0-0 | 0 | 500 | 0 | 0.0 |
| 1st Time | Last Time | # Msgs | Message |
|---|---|---|---|
| 01:21:24 | 01:21:36 | 3 | DNS Fwd/Rev mismatch: lookup of scanner-27.ch1.censys-scanner.com failed |