| |
DIABLO statistics for newsfeed.yoursite.com on Fri 05 Jul 2024 |
Generated on 20240705 2358 by feeder-stats v4.006. Copyright © 2002 The Diablo Project.
Diablo running processes:  84    Dnewslink running processes:  1


12:00AM  up 138 days,  7:19, 0 users, load averages: 7.24, 6.12, 5.05

Filesystem     Size    Used   Avail Capacity  Mounted on
/dev/da0s1g     94G    1.9G     84G     2%    /news
/dev/da1       7.3T    6.6T     88G    99%    /news2/spool/news/00
/dev/da2       7.3T    6.6T     87G    99%    /news2/spool/news/01
/dev/da3       3.7T    3.3T     57G    98%    /news2/spool/news/02
/dev/da4       5.5T      5T     65G    99%    /news2/spool/news/03
/dev/da8       7.3T    6.6T     91G    99%    /news2/spool/news/04
/dev/da9       7.3T    6.6T     92G    99%    /news2/spool/news/05
/dev/da10      7.3T    6.6T     85G    99%    /news2/spool/news/06
/dev/da11      5.5T    4.9T     97G    98%    /news2/spool/news/07
/dev/da12      5.5T      5T     61G    99%    /news2/spool/news/08
/dev/da13      7.3T    6.6T     95G    99%    /news2/spool/news/09
/dev/da14      7.3T    6.6T     88G    99%    /news2/spool/news/10
/dev/da15      7.3T    6.6T     86G    99%    /news2/spool/news/11
/dev/da16      7.3T    6.6T     90G    99%    /news2/spool/news/12
/dev/da17      7.3T    6.6T     86G    99%    /news2/spool/news/13
/dev/da18      7.3T    6.6T     95G    99%    /news2/spool/news/14
/dev/da19      7.3T    6.6T     90G    99%    /news2/spool/news/15
/dev/da20      7.3T    6.6T     93G    99%    /news2/spool/news/16
/dev/da21      7.3T    6.6T     87G    99%    /news2/spool/news/17
/dev/da22      7.3T    6.6T     89G    99%    /news2/spool/news/18
/dev/da23      7.3T    6.6T     94G    99%    /news2/spool/news/19
/dev/da24      7.3T    6.6T     90G    99%    /news2/spool/news/20
/dev/da25      7.3T    6.6T     85G    99%    /news2/spool/news/21
/dev/da26      7.3T    6.6T     84G    99%    /news2/spool/news/22
/dev/da5       221G     36G    167G    18%    /news1
/dev/md0        40G     15G     20G    43%    /news3
| Incoming Feed (+ Top1000 #) | Accepted | %Acc | %Tot | Art/sec | Volume | %Vol | KB/art | Check | Ihave | Spam | TooOld | Rejs | Errs | ||
|---|---|---|---|---|---|---|---|---|---|---|---|---|---|---|---|
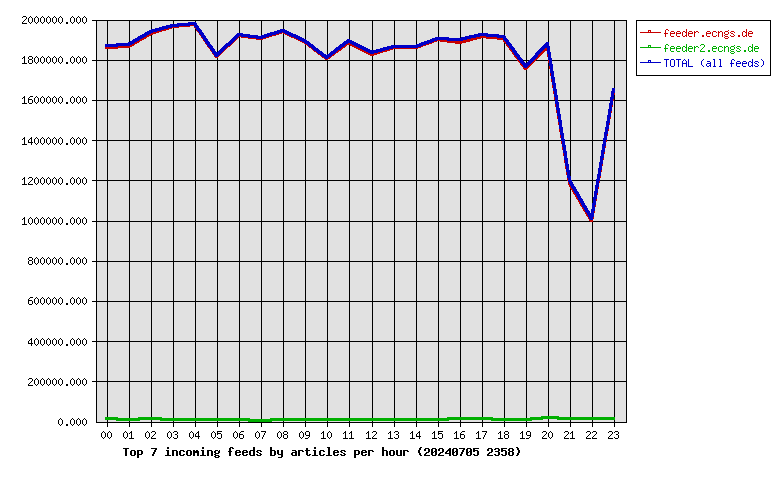
| 1 | feeder.ecngs.de | 43303623 | 90.38 | 99.51 | 501.20 | 29.05TB | 100.00 | 720.26 | 45777815 | 0 | 0 | 0 | 2134598 | 0 | |
| 2 | feeder2.ecngs.de | 212538 | 75.99 | 0.49 | 2.47 | 1.46GB | 0.00 | 7.19 | 278420 | 0 | 0 | 0 | 1276 | 0 | |
| Total | 43516161 | 0.00 | 100.00 | 503.67 | 29.05TB | 100.00 | 716.78 | 46056235 | 0 | 0 | 0 | 2135874 | 0 | ||
 |
| Incoming Feed (+ Top1000 #) | Volume | %Vol | Kbps | Accepted | %Acc | %Tot | KB/art | Check | Ihave | Spam | TooOld | Rejs | Errs | ||
|---|---|---|---|---|---|---|---|---|---|---|---|---|---|---|---|
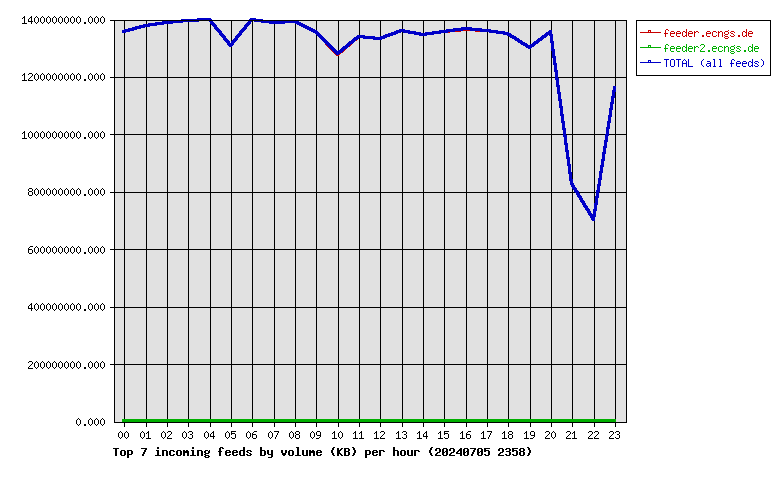
| 1 | feeder.ecngs.de | 29.05TB | 100.00 | 2887950.59 | 43303623 | 90.38 | 99.51 | 720.26 | 45777815 | 0 | 0 | 0 | 2134598 | 0 | |
| 2 | feeder2.ecngs.de | 1.46GB | 0.00 | 142.18 | 212538 | 75.99 | 0.49 | 7.19 | 278420 | 0 | 0 | 0 | 1276 | 0 | |
| Total | 29.05TB | 100.00 | 2888092.77 | 43516161 | 0.00 | 100.00 | 716.78 | 46056235 | 0 | 0 | 0 | 2135874 | 0 | ||
 |
| Incoming Feed (+ Top1000 #) | Rej. Vol. | %Vol | Kbps | Accepted | %Acc | %Tot | KB/art | Check | Ihave | Spam | TooOld | Rejs | Errs | ||
|---|---|---|---|---|---|---|---|---|---|---|---|---|---|---|---|
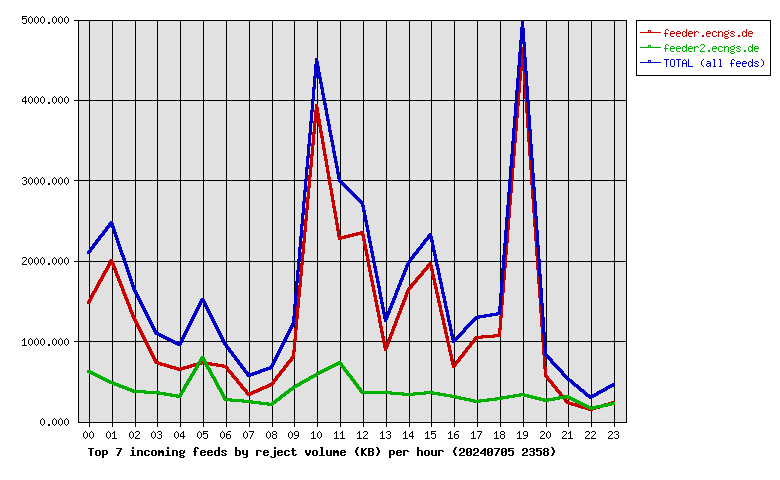
| 1 | feeder.ecngs.de | 29.99MB | 77.66 | 2.84 | 43303623 | 90.38 | 99.51 | 720.26 | 45777815 | 0 | 0 | 0 | 2134598 | 0 | |
| 2 | feeder2.ecngs.de | 8.63MB | 22.34 | 0.82 | 212538 | 75.99 | 0.49 | 7.19 | 278420 | 0 | 0 | 0 | 1276 | 0 | |
| Total | 38.62MB | 100.00 | 3.67 | 43516161 | 0.00 | 100.00 | 716.78 | 46056235 | 0 | 0 | 0 | 2135874 | 0 | ||
 |
| Hour | Accepted | %Acc | Volume | %Vol | Check | Ihave | Spam | Rejs | Errs |
|---|---|---|---|---|---|---|---|---|---|
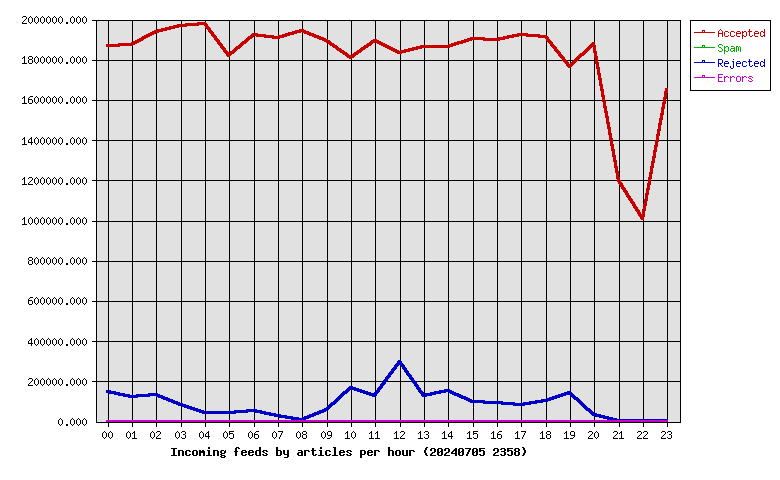
| 00 | 1869536 | 4.30 | 1.26TB | 4.35 | 2035639 | 0 | 0 | 148120 | 0 |
| 01 | 1872989 | 4.30 | 1.28TB | 4.42 | 2013614 | 0 | 0 | 124167 | 0 |
| 02 | 1940123 | 4.46 | 1.29TB | 4.45 | 2089454 | 0 | 0 | 133694 | 0 |
| 03 | 1969789 | 4.53 | 1.30TB | 4.47 | 2062598 | 0 | 0 | 81600 | 0 |
| 04 | 1979848 | 4.55 | 1.30TB | 4.48 | 2030624 | 0 | 0 | 39857 | 0 |
| 05 | 1817949 | 4.18 | 1.22TB | 4.19 | 1923265 | 0 | 0 | 40726 | 0 |
| 06 | 1924113 | 4.42 | 1.30TB | 4.49 | 1986117 | 0 | 0 | 53097 | 0 |
| 07 | 1907751 | 4.38 | 1.29TB | 4.45 | 1940441 | 0 | 0 | 25066 | 0 |
| 08 | 1945070 | 4.47 | 1.30TB | 4.46 | 1965042 | 0 | 0 | 9012 | 0 |
| 09 | 1895236 | 4.36 | 1.26TB | 4.34 | 1967101 | 0 | 0 | 58799 | 0 |
| 10 | 1810932 | 4.16 | 1.19TB | 4.10 | 1985631 | 0 | 0 | 164480 | 0 |
| 11 | 1891219 | 4.35 | 1.25TB | 4.30 | 2033284 | 0 | 0 | 129086 | 0 |
| 12 | 1832749 | 4.21 | 1.24TB | 4.27 | 2143012 | 0 | 0 | 296447 | 0 |
| 13 | 1863414 | 4.28 | 1.27TB | 4.36 | 2004134 | 0 | 0 | 129187 | 0 |
| 14 | 1862692 | 4.28 | 1.25TB | 4.31 | 2027275 | 0 | 0 | 153206 | 0 |
| 15 | 1904693 | 4.38 | 1.26TB | 4.35 | 2014581 | 0 | 0 | 97941 | 0 |
| 16 | 1896078 | 4.36 | 1.27TB | 4.38 | 2005663 | 0 | 0 | 91988 | 0 |
| 17 | 1924023 | 4.42 | 1.27TB | 4.36 | 2023461 | 0 | 0 | 83281 | 0 |
| 18 | 1911685 | 4.39 | 1.26TB | 4.33 | 2029087 | 0 | 0 | 103431 | 0 |
| 19 | 1764255 | 4.05 | 1.21TB | 4.17 | 1932147 | 0 | 0 | 140457 | 0 |
| 20 | 1877710 | 4.31 | 1.26TB | 4.35 | 1937122 | 0 | 0 | 31433 | 0 |
| 21 | 1195270 | 2.75 | 789.06GB | 2.65 | 1215110 | 0 | 0 | 688 | 0 |
| 22 | 1009454 | 2.32 | 670.02GB | 2.25 | 1025250 | 0 | 0 | 39 | 0 |
| 23 | 1649583 | 3.79 | 1.08TB | 3.72 | 1666583 | 0 | 0 | 72 | 0 |
| Total | 43516161 | 100.00 | 29.05TB | 100.00 | 46056235 | 0 | 0 | 2135874 | 0 |
 |
| Outgoing Feed (+ Top1000 #) | Accepted | %Acc | %Tot | Art/sec | Volume | %Vol | KB/art | Dups | Rejs | % Ratio (Out/In) | ||
|---|---|---|---|---|---|---|---|---|---|---|---|---|
| 1 | 217.73.144.40 | 0 | 0.00 | 0.00 | 0.00 | 0.00KB | 0.00 | 0.00 | 45480594 | 0 | … | |
| Total | 0 | 0.00 | 0.00 | 0.00 | 0.00KB | 0.00 | 0.00 | 45480594 | 0 | |||
 |
| Outgoing Feed (+ Top1000 #) | Volume | %Vol | Kbps | Accepted | %Acc | %Tot | KB/art | Dups | Rejs | % Ratio (Out/In) | ||
|---|---|---|---|---|---|---|---|---|---|---|---|---|
| 1 | 217.73.144.40 | 0.00KB | 0.00 | 0.00 | 0 | 0.00 | 0.00 | 0.00 | 45480594 | 0 | … | |
| Total | 0.00KB | 0.00 | 0.00 | 0 | 0.00 | 0.00 | 0.00 | 45480594 | 0 | |||
 |
| Outgoing Feed (+ Top1000 #) | Rej. Vol. | %Vol | Kbps | Accepted | %Acc | %Tot | KB/art | Dups | Rejs | % Ratio (Out/In) | ||
|---|---|---|---|---|---|---|---|---|---|---|---|---|
| 1 | 217.73.144.40 | 0.00KB | 0.00 | 0.00 | 0 | 0.00 | 0.00 | 0.00 | 45480594 | 0 | … | |
| Total | 0.00KB | 0.00 | 0.00 | 0 | 0.00 | 0.00 | 0.00 | 45480594 | 0 | |||
 |
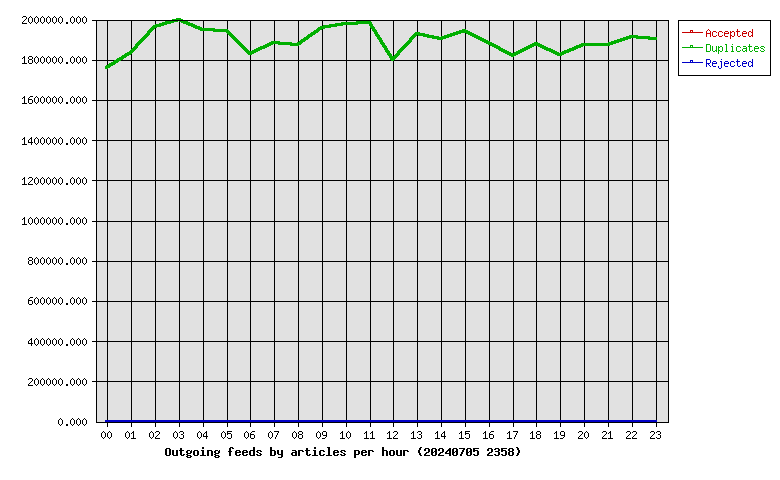
| Hour | Accepted | %Acc | Volume | %Vol | dups | Rejs |
|---|---|---|---|---|---|---|
| 00 | 0 | 0.00 | 0.00KB | 0.00 | 1757051 | 0 |
| 01 | 0 | 0.00 | 0.00KB | 0.00 | 1835161 | 0 |
| 02 | 0 | 0.00 | 0.00KB | 0.00 | 1962689 | 0 |
| 03 | 0 | 0.00 | 0.00KB | 0.00 | 1996498 | 0 |
| 04 | 0 | 0.00 | 0.00KB | 0.00 | 1949518 | 0 |
| 05 | 0 | 0.00 | 0.00KB | 0.00 | 1941987 | 0 |
| 06 | 0 | 0.00 | 0.00KB | 0.00 | 1826614 | 0 |
| 07 | 0 | 0.00 | 0.00KB | 0.00 | 1882442 | 0 |
| 08 | 0 | 0.00 | 0.00KB | 0.00 | 1874591 | 0 |
| 09 | 0 | 0.00 | 0.00KB | 0.00 | 1955622 | 0 |
| 10 | 0 | 0.00 | 0.00KB | 0.00 | 1976062 | 0 |
| 11 | 0 | 0.00 | 0.00KB | 0.00 | 1980801 | 0 |
| 12 | 0 | 0.00 | 0.00KB | 0.00 | 1799279 | 0 |
| 13 | 0 | 0.00 | 0.00KB | 0.00 | 1929084 | 0 |
| 14 | 0 | 0.00 | 0.00KB | 0.00 | 1904586 | 0 |
| 15 | 0 | 0.00 | 0.00KB | 0.00 | 1940541 | 0 |
| 16 | 0 | 0.00 | 0.00KB | 0.00 | 1883848 | 0 |
| 17 | 0 | 0.00 | 0.00KB | 0.00 | 1816759 | 0 |
| 18 | 0 | 0.00 | 0.00KB | 0.00 | 1879617 | 0 |
| 19 | 0 | 0.00 | 0.00KB | 0.00 | 1825162 | 0 |
| 20 | 0 | 0.00 | 0.00KB | 0.00 | 1871455 | 0 |
| 21 | 0 | 0.00 | 0.00KB | 0.00 | 1870702 | 0 |
| 22 | 0 | 0.00 | 0.00KB | 0.00 | 1915182 | 0 |
| 23 | 0 | 0.00 | 0.00KB | 0.00 | 1905343 | 0 |
| Total | 0 | 0.00 | 0.00KB | 0.00 | 45480594 | 0 |
 |
| >= 20% Full | >= 35% Full | >= 50% Full | >= 65% Full | >= 80% Full | >= 95% Full |
| Outgoing Feed | Batch Seq | Batch Num | Batch Max | %Full | Av. Pending |
|---|---|---|---|---|---|
| nbr.elbracht.net-o | 966464-966545 | 81 | 500 | 16 | 0.0 |
| text-spool-out | 0-0 | 0 | 500 | 0 | 0.0 |
| 1st Time | Last Time | # Msgs | Message |
|---|---|---|---|
| 19:29:01 | 1 | DNS Fwd/Rev mismatch: lookup of unused-space.coop.net failed |