| |
DIABLO statistics for newsfeed.yoursite.com on Thu 04 Jul 2024 |
Generated on 20240704 2358 by feeder-stats v4.006. Copyright © 2002 The Diablo Project.
Diablo running processes:  88    Dnewslink running processes:  1


12:00AM  up 137 days,  7:19, 0 users, load averages: 9.16, 8.46, 8.72

Filesystem     Size    Used   Avail Capacity  Mounted on
/dev/da0s1g     94G    2.1G     84G     2%    /news
/dev/da1       7.3T    6.7T     42G    99%    /news2/spool/news/00
/dev/da2       7.3T    6.7T     41G    99%    /news2/spool/news/01
/dev/da3       3.7T    3.3T     71G    98%    /news2/spool/news/02
/dev/da4       5.5T      5T     63G    99%    /news2/spool/news/03
/dev/da8       7.3T    6.7T     42G    99%    /news2/spool/news/04
/dev/da9       7.3T    6.7T     45G    99%    /news2/spool/news/05
/dev/da10      7.3T    6.7T     40G    99%    /news2/spool/news/06
/dev/da11      5.5T      5T     58G    99%    /news2/spool/news/07
/dev/da12      5.5T      5T     75G    99%    /news2/spool/news/08
/dev/da13      7.3T    6.7T     49G    99%    /news2/spool/news/09
/dev/da14      7.3T    6.7T     43G    99%    /news2/spool/news/10
/dev/da15      7.3T    6.7T     41G    99%    /news2/spool/news/11
/dev/da16      7.3T    6.7T     43G    99%    /news2/spool/news/12
/dev/da17      7.3T    6.7T     38G    99%    /news2/spool/news/13
/dev/da18      7.3T    6.7T     44G    99%    /news2/spool/news/14
/dev/da19      7.3T    6.7T     42G    99%    /news2/spool/news/15
/dev/da20      7.3T    6.7T     47G    99%    /news2/spool/news/16
/dev/da21      7.3T    6.7T     39G    99%    /news2/spool/news/17
/dev/da22      7.3T    6.7T     42G    99%    /news2/spool/news/18
/dev/da23      7.3T    6.7T     44G    99%    /news2/spool/news/19
/dev/da24      7.3T    6.7T     46G    99%    /news2/spool/news/20
/dev/da25      7.3T    6.7T     40G    99%    /news2/spool/news/21
/dev/da26      7.3T    6.6T     93G    99%    /news2/spool/news/22
/dev/da5       221G     36G    167G    18%    /news1
/dev/md0        40G     15G     20G    43%    /news3
| Incoming Feed (+ Top1000 #) | Accepted | %Acc | %Tot | Art/sec | Volume | %Vol | KB/art | Check | Ihave | Spam | TooOld | Rejs | Errs | ||
|---|---|---|---|---|---|---|---|---|---|---|---|---|---|---|---|
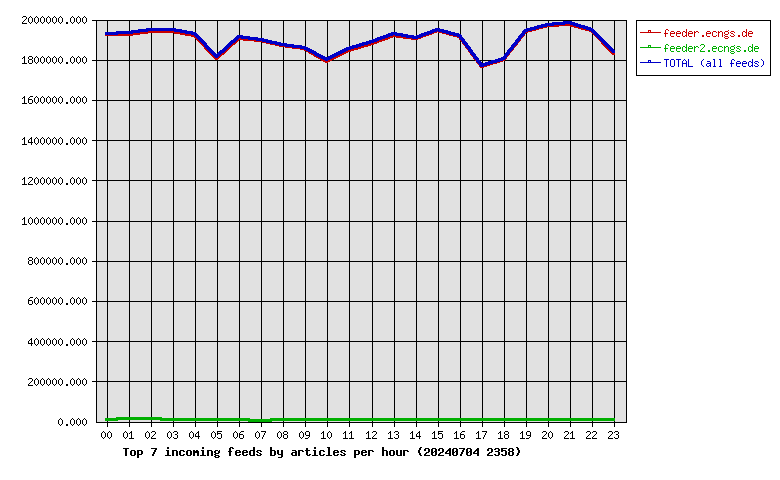
| 1 | feeder.ecngs.de | 45347200 | 83.02 | 99.62 | 524.85 | 30.30TB | 99.99 | 717.54 | 50124517 | 0 | 0 | 0 | 4500751 | 0 | |
| 2 | feeder2.ecngs.de | 173030 | 75.41 | 0.38 | 2.01 | 1.55GB | 0.01 | 9.41 | 228167 | 0 | 0 | 0 | 1277 | 0 | |
| Total | 45520230 | 0.00 | 100.00 | 526.86 | 30.31TB | 100.00 | 714.85 | 50352684 | 0 | 0 | 0 | 4502028 | 0 | ||
 |
| Incoming Feed (+ Top1000 #) | Volume | %Vol | Kbps | Accepted | %Acc | %Tot | KB/art | Check | Ihave | Spam | TooOld | Rejs | Errs | ||
|---|---|---|---|---|---|---|---|---|---|---|---|---|---|---|---|
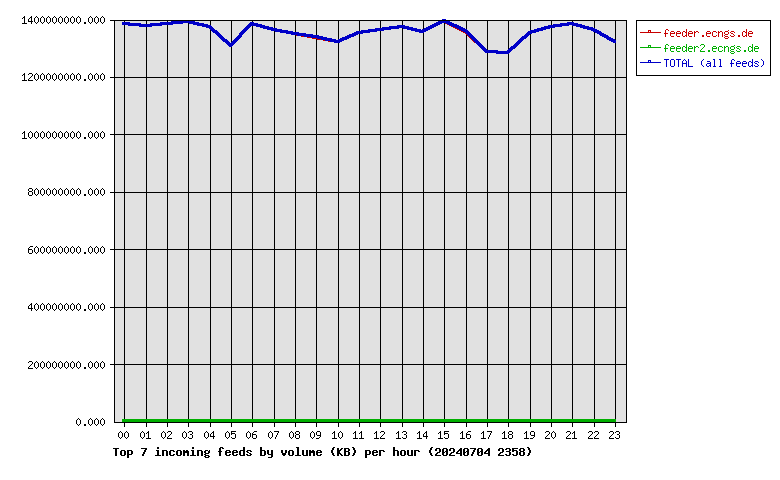
| 1 | feeder.ecngs.de | 30.30TB | 99.99 | 3012813.79 | 45347200 | 83.02 | 99.62 | 717.54 | 50124517 | 0 | 0 | 0 | 4500751 | 0 | |
| 2 | feeder2.ecngs.de | 1.55GB | 0.01 | 151.32 | 173030 | 75.41 | 0.38 | 9.41 | 228167 | 0 | 0 | 0 | 1277 | 0 | |
| Total | 30.31TB | 100.00 | 3012965.11 | 45520230 | 0.00 | 100.00 | 714.85 | 50352684 | 0 | 0 | 0 | 4502028 | 0 | ||
 |
| Incoming Feed (+ Top1000 #) | Rej. Vol. | %Vol | Kbps | Accepted | %Acc | %Tot | KB/art | Check | Ihave | Spam | TooOld | Rejs | Errs | ||
|---|---|---|---|---|---|---|---|---|---|---|---|---|---|---|---|
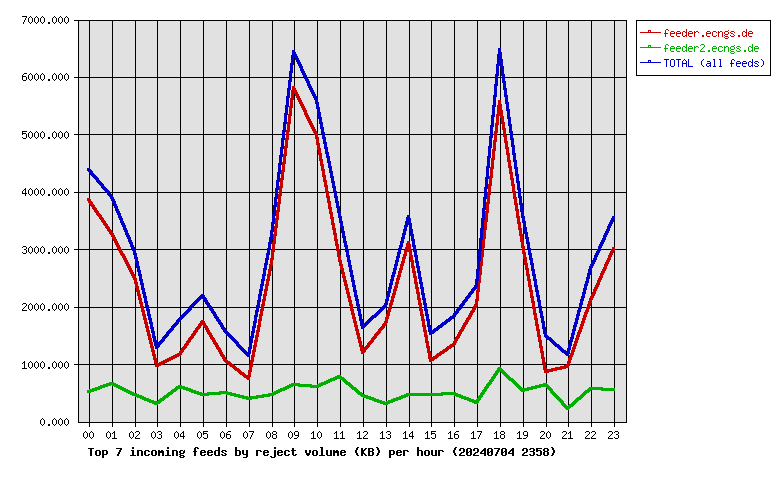
| 1 | feeder.ecngs.de | 56.25MB | 82.45 | 5.33 | 45347200 | 83.02 | 99.62 | 717.54 | 50124517 | 0 | 0 | 0 | 4500751 | 0 | |
| 2 | feeder2.ecngs.de | 11.97MB | 17.55 | 1.14 | 173030 | 75.41 | 0.38 | 9.41 | 228167 | 0 | 0 | 0 | 1277 | 0 | |
| Total | 68.23MB | 100.00 | 6.47 | 45520230 | 0.00 | 100.00 | 714.85 | 50352684 | 0 | 0 | 0 | 4502028 | 0 | ||
 |
| Hour | Accepted | %Acc | Volume | %Vol | Check | Ihave | Spam | Rejs | Errs |
|---|---|---|---|---|---|---|---|---|---|
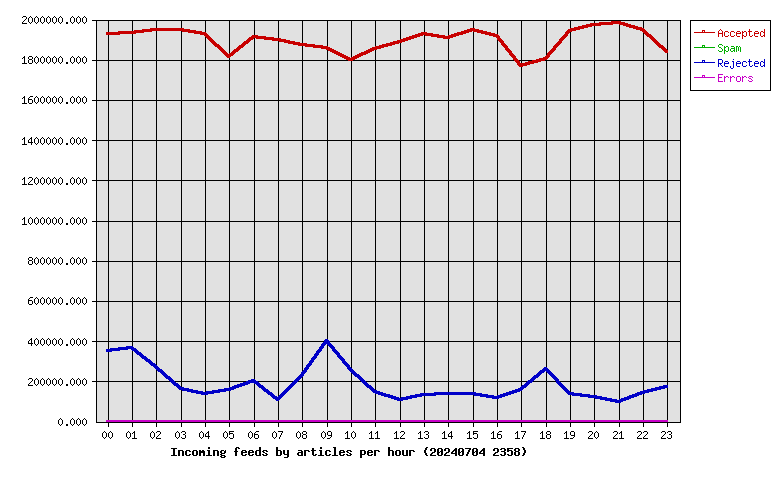
| 00 | 1927985 | 4.24 | 1.29TB | 4.25 | 2291279 | 0 | 0 | 351665 | 0 |
| 01 | 1934514 | 4.25 | 1.28TB | 4.24 | 2318039 | 0 | 0 | 365453 | 0 |
| 02 | 1947133 | 4.28 | 1.29TB | 4.25 | 2237166 | 0 | 0 | 272890 | 0 |
| 03 | 1946690 | 4.28 | 1.29TB | 4.27 | 2122777 | 0 | 0 | 161933 | 0 |
| 04 | 1926054 | 4.23 | 1.28TB | 4.23 | 2077130 | 0 | 0 | 138093 | 0 |
| 05 | 1811445 | 3.98 | 1.22TB | 4.02 | 2023712 | 0 | 0 | 157125 | 0 |
| 06 | 1912391 | 4.20 | 1.29TB | 4.25 | 2129092 | 0 | 0 | 203975 | 0 |
| 07 | 1896292 | 4.17 | 1.27TB | 4.19 | 2007784 | 0 | 0 | 105468 | 0 |
| 08 | 1873918 | 4.12 | 1.26TB | 4.15 | 2108865 | 0 | 0 | 225825 | 0 |
| 09 | 1858763 | 4.08 | 1.25TB | 4.11 | 2266184 | 0 | 0 | 398296 | 0 |
| 10 | 1796524 | 3.95 | 1.23TB | 4.06 | 2062010 | 0 | 0 | 255539 | 0 |
| 11 | 1851619 | 4.07 | 1.26TB | 4.16 | 2012923 | 0 | 0 | 149036 | 0 |
| 12 | 1886070 | 4.14 | 1.27TB | 4.19 | 2005073 | 0 | 0 | 106331 | 0 |
| 13 | 1926065 | 4.23 | 1.28TB | 4.22 | 2071037 | 0 | 0 | 133214 | 0 |
| 14 | 1908917 | 4.19 | 1.26TB | 4.17 | 2059664 | 0 | 0 | 137080 | 0 |
| 15 | 1948271 | 4.28 | 1.30TB | 4.29 | 2093765 | 0 | 0 | 135653 | 0 |
| 16 | 1917339 | 4.21 | 1.26TB | 4.17 | 2043539 | 0 | 0 | 115339 | 0 |
| 17 | 1766726 | 3.88 | 1.20TB | 3.96 | 1933512 | 0 | 0 | 157633 | 0 |
| 18 | 1801950 | 3.96 | 1.19TB | 3.94 | 2074358 | 0 | 0 | 262952 | 0 |
| 19 | 1942863 | 4.27 | 1.26TB | 4.16 | 2098367 | 0 | 0 | 137076 | 0 |
| 20 | 1973151 | 4.33 | 1.28TB | 4.22 | 2109045 | 0 | 0 | 123646 | 0 |
| 21 | 1980935 | 4.35 | 1.29TB | 4.26 | 2086370 | 0 | 0 | 95587 | 0 |
| 22 | 1947796 | 4.28 | 1.27TB | 4.19 | 2100320 | 0 | 0 | 141558 | 0 |
| 23 | 1836819 | 4.04 | 1.23TB | 4.06 | 2020673 | 0 | 0 | 170661 | 0 |
| Total | 45520230 | 100.00 | 30.31TB | 100.00 | 50352684 | 0 | 0 | 4502028 | 0 |
 |
| Outgoing Feed (+ Top1000 #) | Accepted | %Acc | %Tot | Art/sec | Volume | %Vol | KB/art | Dups | Rejs | % Ratio (Out/In) | ||
|---|---|---|---|---|---|---|---|---|---|---|---|---|
| 1 | 217.73.144.40 | 0 | 0.00 | 0.00 | 0.00 | 0.00KB | 0.00 | 0.00 | 45400041 | 0 | … | |
| Total | 0 | 0.00 | 0.00 | 0.00 | 0.00KB | 0.00 | 0.00 | 45400041 | 0 | |||
 |
| Outgoing Feed (+ Top1000 #) | Volume | %Vol | Kbps | Accepted | %Acc | %Tot | KB/art | Dups | Rejs | % Ratio (Out/In) | ||
|---|---|---|---|---|---|---|---|---|---|---|---|---|
| 1 | 217.73.144.40 | 0.00KB | 0.00 | 0.00 | 0 | 0.00 | 0.00 | 0.00 | 45400041 | 0 | … | |
| Total | 0.00KB | 0.00 | 0.00 | 0 | 0.00 | 0.00 | 0.00 | 45400041 | 0 | |||
 |
| Outgoing Feed (+ Top1000 #) | Rej. Vol. | %Vol | Kbps | Accepted | %Acc | %Tot | KB/art | Dups | Rejs | % Ratio (Out/In) | ||
|---|---|---|---|---|---|---|---|---|---|---|---|---|
| 1 | 217.73.144.40 | 0.00KB | 0.00 | 0.00 | 0 | 0.00 | 0.00 | 0.00 | 45400041 | 0 | … | |
| Total | 0.00KB | 0.00 | 0.00 | 0 | 0.00 | 0.00 | 0.00 | 45400041 | 0 | |||
 |
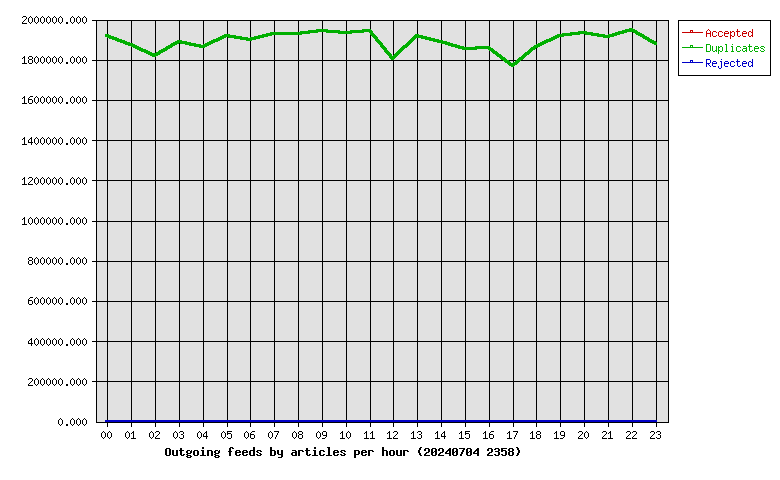
| Hour | Accepted | %Acc | Volume | %Vol | dups | Rejs |
|---|---|---|---|---|---|---|
| 00 | 0 | 0.00 | 0.00KB | 0.00 | 1919519 | 0 |
| 01 | 0 | 0.00 | 0.00KB | 0.00 | 1871318 | 0 |
| 02 | 0 | 0.00 | 0.00KB | 0.00 | 1816436 | 0 |
| 03 | 0 | 0.00 | 0.00KB | 0.00 | 1888119 | 0 |
| 04 | 0 | 0.00 | 0.00KB | 0.00 | 1862368 | 0 |
| 05 | 0 | 0.00 | 0.00KB | 0.00 | 1918498 | 0 |
| 06 | 0 | 0.00 | 0.00KB | 0.00 | 1899787 | 0 |
| 07 | 0 | 0.00 | 0.00KB | 0.00 | 1930150 | 0 |
| 08 | 0 | 0.00 | 0.00KB | 0.00 | 1929035 | 0 |
| 09 | 0 | 0.00 | 0.00KB | 0.00 | 1943921 | 0 |
| 10 | 0 | 0.00 | 0.00KB | 0.00 | 1931051 | 0 |
| 11 | 0 | 0.00 | 0.00KB | 0.00 | 1942143 | 0 |
| 12 | 0 | 0.00 | 0.00KB | 0.00 | 1804479 | 0 |
| 13 | 0 | 0.00 | 0.00KB | 0.00 | 1919620 | 0 |
| 14 | 0 | 0.00 | 0.00KB | 0.00 | 1889861 | 0 |
| 15 | 0 | 0.00 | 0.00KB | 0.00 | 1855126 | 0 |
| 16 | 0 | 0.00 | 0.00KB | 0.00 | 1855824 | 0 |
| 17 | 0 | 0.00 | 0.00KB | 0.00 | 1767632 | 0 |
| 18 | 0 | 0.00 | 0.00KB | 0.00 | 1863393 | 0 |
| 19 | 0 | 0.00 | 0.00KB | 0.00 | 1918874 | 0 |
| 20 | 0 | 0.00 | 0.00KB | 0.00 | 1934639 | 0 |
| 21 | 0 | 0.00 | 0.00KB | 0.00 | 1911679 | 0 |
| 22 | 0 | 0.00 | 0.00KB | 0.00 | 1946031 | 0 |
| 23 | 0 | 0.00 | 0.00KB | 0.00 | 1880538 | 0 |
| Total | 0 | 0.00 | 0.00KB | 0.00 | 45400041 | 0 |
 |
| >= 20% Full | >= 35% Full | >= 50% Full | >= 65% Full | >= 80% Full | >= 95% Full |
| Outgoing Feed | Batch Seq | Batch Num | Batch Max | %Full | Av. Pending |
|---|---|---|---|---|---|
| nbr.elbracht.net-o | 966176-966257 | 81 | 500 | 16 | 0.0 |
| text-spool-out | 0-0 | 0 | 500 | 0 | 0.0 |
| 1st Time | Last Time | # Msgs | Message |
|---|---|---|---|
| 00:30:10 | 00:30:24 | 5 | DNS Fwd/Rev mismatch: lookup of unused-space.coop.net failed |