| |
DIABLO statistics for newsfeed.yoursite.com on Wed 03 Jul 2024 |
Generated on 20240703 2358 by feeder-stats v4.006. Copyright © 2002 The Diablo Project.
Diablo running processes:  88    Dnewslink running processes:  1


12:00AM  up 136 days,  7:19, 0 users, load averages: 8.41, 7.48, 7.45

Filesystem     Size    Used   Avail Capacity  Mounted on
/dev/da0s1g     94G    2.1G     84G     2%    /news
/dev/da1       7.3T    6.6T     72G    99%    /news2/spool/news/00
/dev/da2       7.3T    6.6T     69G    99%    /news2/spool/news/01
/dev/da3       3.7T    3.3T     82G    98%    /news2/spool/news/02
/dev/da4       5.5T      5T     68G    99%    /news2/spool/news/03
/dev/da8       7.3T    6.6T     68G    99%    /news2/spool/news/04
/dev/da9       7.3T    6.6T     72G    99%    /news2/spool/news/05
/dev/da10      7.3T    6.6T     70G    99%    /news2/spool/news/06
/dev/da11      5.5T      5T     57G    99%    /news2/spool/news/07
/dev/da12      5.5T      5T     58G    99%    /news2/spool/news/08
/dev/da13      7.3T    6.6T     74G    99%    /news2/spool/news/09
/dev/da14      7.3T    6.6T     72G    99%    /news2/spool/news/10
/dev/da15      7.3T    6.6T     71G    99%    /news2/spool/news/11
/dev/da16      7.3T    6.6T     69G    99%    /news2/spool/news/12
/dev/da17      7.3T    6.6T     69G    99%    /news2/spool/news/13
/dev/da18      7.3T    6.6T     69G    99%    /news2/spool/news/14
/dev/da19      7.3T    6.6T     69G    99%    /news2/spool/news/15
/dev/da20      7.3T    6.6T     74G    99%    /news2/spool/news/16
/dev/da21      7.3T    6.6T     65G    99%    /news2/spool/news/17
/dev/da22      7.3T    6.6T     72G    99%    /news2/spool/news/18
/dev/da23      7.3T    6.6T     70G    99%    /news2/spool/news/19
/dev/da24      7.3T    6.6T     73G    99%    /news2/spool/news/20
/dev/da25      7.3T    6.6T     70G    99%    /news2/spool/news/21
/dev/da26      7.3T    6.6T     66G    99%    /news2/spool/news/22
/dev/da5       221G     36G    166G    18%    /news1
/dev/md0        40G     15G     20G    43%    /news3
| Incoming Feed (+ Top1000 #) | Accepted | %Acc | %Tot | Art/sec | Volume | %Vol | KB/art | Check | Ihave | Spam | TooOld | Rejs | Errs | ||
|---|---|---|---|---|---|---|---|---|---|---|---|---|---|---|---|
| 1 | feeder.ecngs.de | 45049717 | 80.12 | 99.67 | 521.41 | 30.16TB | 100.00 | 718.79 | 50764005 | 0 | 0 | 0 | 5467124 | 0 | |
| 2 | feeder2.ecngs.de | 147983 | 75.66 | 0.33 | 1.72 | 1.38GB | 0.00 | 9.75 | 194371 | 0 | 0 | 0 | 1222 | 0 | |
| Total | 45197700 | 0.00 | 100.00 | 523.13 | 30.16TB | 100.00 | 716.47 | 50958376 | 0 | 0 | 0 | 5468346 | 0 | ||
 |
| Incoming Feed (+ Top1000 #) | Volume | %Vol | Kbps | Accepted | %Acc | %Tot | KB/art | Check | Ihave | Spam | TooOld | Rejs | Errs | ||
|---|---|---|---|---|---|---|---|---|---|---|---|---|---|---|---|
| 1 | feeder.ecngs.de | 30.16TB | 100.00 | 2998271.93 | 45049717 | 80.12 | 99.67 | 718.79 | 50764005 | 0 | 0 | 0 | 5467124 | 0 | |
| 2 | feeder2.ecngs.de | 1.38GB | 0.00 | 134.52 | 147983 | 75.66 | 0.33 | 9.75 | 194371 | 0 | 0 | 0 | 1222 | 0 | |
| Total | 30.16TB | 100.00 | 2998406.45 | 45197700 | 0.00 | 100.00 | 716.47 | 50958376 | 0 | 0 | 0 | 5468346 | 0 | ||
 |
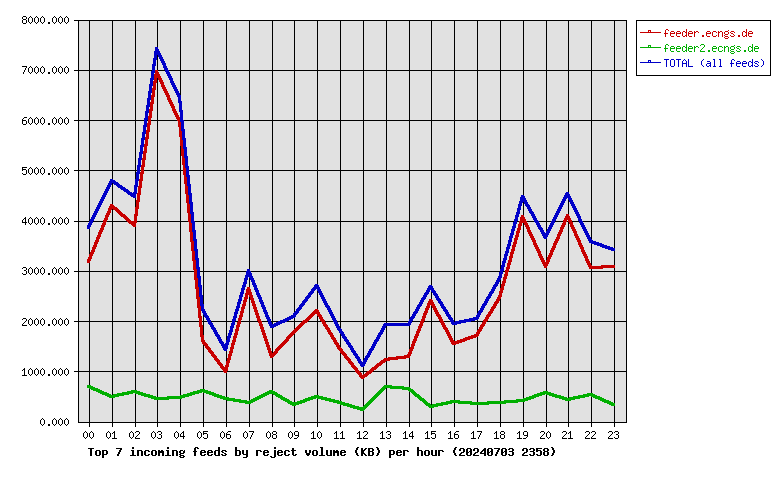
| Incoming Feed (+ Top1000 #) | Rej. Vol. | %Vol | Kbps | Accepted | %Acc | %Tot | KB/art | Check | Ihave | Spam | TooOld | Rejs | Errs | ||
|---|---|---|---|---|---|---|---|---|---|---|---|---|---|---|---|
| 1 | feeder.ecngs.de | 63.48MB | 85.37 | 6.02 | 45049717 | 80.12 | 99.67 | 718.79 | 50764005 | 0 | 0 | 0 | 5467124 | 0 | |
| 2 | feeder2.ecngs.de | 10.88MB | 14.63 | 1.04 | 147983 | 75.66 | 0.33 | 9.75 | 194371 | 0 | 0 | 0 | 1222 | 0 | |
| Total | 74.36MB | 100.00 | 7.06 | 45197700 | 0.00 | 100.00 | 716.47 | 50958376 | 0 | 0 | 0 | 5468346 | 0 | ||
 |
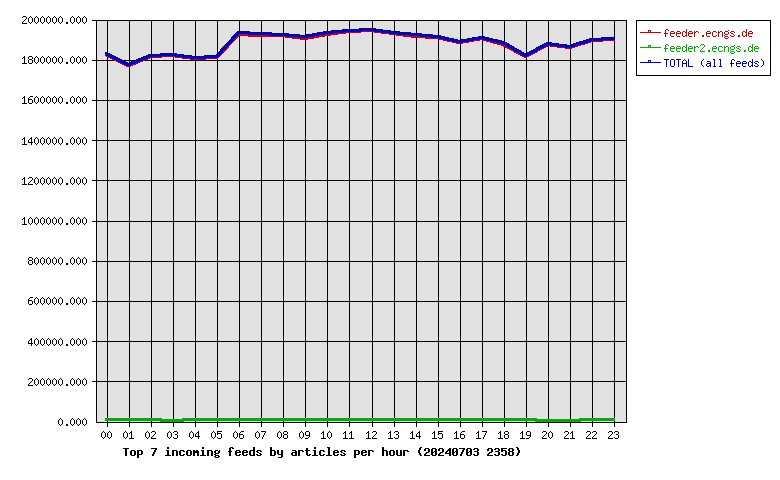
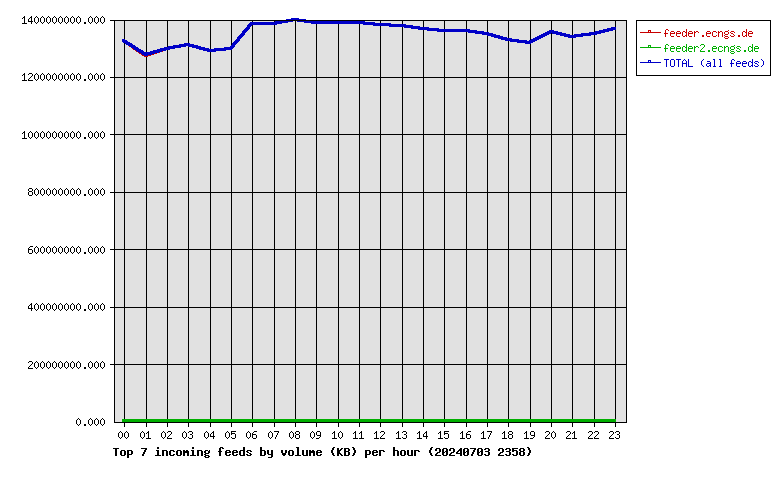
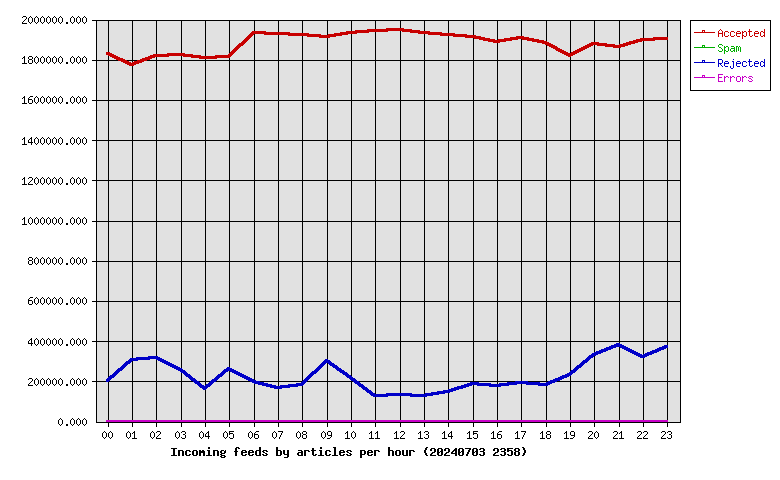
| Hour | Accepted | %Acc | Volume | %Vol | Check | Ihave | Spam | Rejs | Errs |
|---|---|---|---|---|---|---|---|---|---|
| 00 | 1828541 | 4.05 | 1.23TB | 4.09 | 2041570 | 0 | 0 | 201294 | 0 |
| 01 | 1775558 | 3.93 | 1.19TB | 3.94 | 2095428 | 0 | 0 | 306817 | 0 |
| 02 | 1820597 | 4.03 | 1.21TB | 4.01 | 2150564 | 0 | 0 | 315446 | 0 |
| 03 | 1822870 | 4.03 | 1.22TB | 4.05 | 2086454 | 0 | 0 | 254411 | 0 |
| 04 | 1809824 | 4.00 | 1.20TB | 3.98 | 1983151 | 0 | 0 | 163570 | 0 |
| 05 | 1812401 | 4.01 | 1.21TB | 4.01 | 2135727 | 0 | 0 | 260454 | 0 |
| 06 | 1931722 | 4.27 | 1.29TB | 4.28 | 2139507 | 0 | 0 | 197544 | 0 |
| 07 | 1926610 | 4.26 | 1.29TB | 4.28 | 2100690 | 0 | 0 | 164730 | 0 |
| 08 | 1924603 | 4.26 | 1.30TB | 4.31 | 2114359 | 0 | 0 | 180075 | 0 |
| 09 | 1911429 | 4.23 | 1.29TB | 4.28 | 2223789 | 0 | 0 | 298551 | 0 |
| 10 | 1930703 | 4.27 | 1.29TB | 4.29 | 2158619 | 0 | 0 | 218154 | 0 |
| 11 | 1941976 | 4.30 | 1.29TB | 4.29 | 2076575 | 0 | 0 | 125400 | 0 |
| 12 | 1947459 | 4.31 | 1.29TB | 4.26 | 2088684 | 0 | 0 | 130747 | 0 |
| 13 | 1933964 | 4.28 | 1.28TB | 4.26 | 2071137 | 0 | 0 | 128231 | 0 |
| 14 | 1921421 | 4.25 | 1.27TB | 4.22 | 2081163 | 0 | 0 | 147678 | 0 |
| 15 | 1913198 | 4.23 | 1.27TB | 4.20 | 2108280 | 0 | 0 | 186765 | 0 |
| 16 | 1889095 | 4.18 | 1.27TB | 4.20 | 2073965 | 0 | 0 | 176624 | 0 |
| 17 | 1909376 | 4.22 | 1.26TB | 4.17 | 2112590 | 0 | 0 | 193906 | 0 |
| 18 | 1880654 | 4.16 | 1.24TB | 4.10 | 2070672 | 0 | 0 | 180917 | 0 |
| 19 | 1820131 | 4.03 | 1.23TB | 4.07 | 2061408 | 0 | 0 | 232732 | 0 |
| 20 | 1879920 | 4.16 | 1.26TB | 4.19 | 2216394 | 0 | 0 | 328834 | 0 |
| 21 | 1862084 | 4.12 | 1.25TB | 4.13 | 2250877 | 0 | 0 | 380972 | 0 |
| 22 | 1899602 | 4.20 | 1.26TB | 4.17 | 2229009 | 0 | 0 | 321621 | 0 |
| 23 | 1903962 | 4.21 | 1.27TB | 4.22 | 2287764 | 0 | 0 | 372873 | 0 |
| Total | 45197700 | 100.00 | 30.16TB | 100.00 | 50958376 | 0 | 0 | 5468346 | 0 |
 |
| Outgoing Feed (+ Top1000 #) | Accepted | %Acc | %Tot | Art/sec | Volume | %Vol | KB/art | Dups | Rejs | % Ratio (Out/In) | ||
|---|---|---|---|---|---|---|---|---|---|---|---|---|
| 1 | 217.73.144.40 | 1 | 0.00 | 100.00 | 0.00 | 0.66KB | 100.00 | 0.66 | 45272059 | 0 | … | |
| Total | 1 | 0.00 | 100.00 | 0.00 | 0.66KB | 100.00 | 0.66 | 45272059 | 0 | 0.00 | ||
 |
| Outgoing Feed (+ Top1000 #) | Volume | %Vol | Kbps | Accepted | %Acc | %Tot | KB/art | Dups | Rejs | % Ratio (Out/In) | ||
|---|---|---|---|---|---|---|---|---|---|---|---|---|
| 1 | 217.73.144.40 | 0.66KB | 100.00 | 0.00 | 1 | 0.00 | 100.00 | 0.66 | 45272059 | 0 | … | |
| Total | 0.66KB | 100.00 | 0.00 | 1 | 0.00 | 100.00 | 0.66 | 45272059 | 0 | 0.00 | ||
 |
| Outgoing Feed (+ Top1000 #) | Rej. Vol. | %Vol | Kbps | Accepted | %Acc | %Tot | KB/art | Dups | Rejs | % Ratio (Out/In) | ||
|---|---|---|---|---|---|---|---|---|---|---|---|---|
| 1 | 217.73.144.40 | 0.00KB | 0.00 | 0.00 | 1 | 0.00 | 100.00 | 0.66 | 45272059 | 0 | … | |
| Total | 0.00KB | 0.00 | 0.00 | 1 | 0.00 | 100.00 | 0.66 | 45272059 | 0 | 0.00 | ||
 |
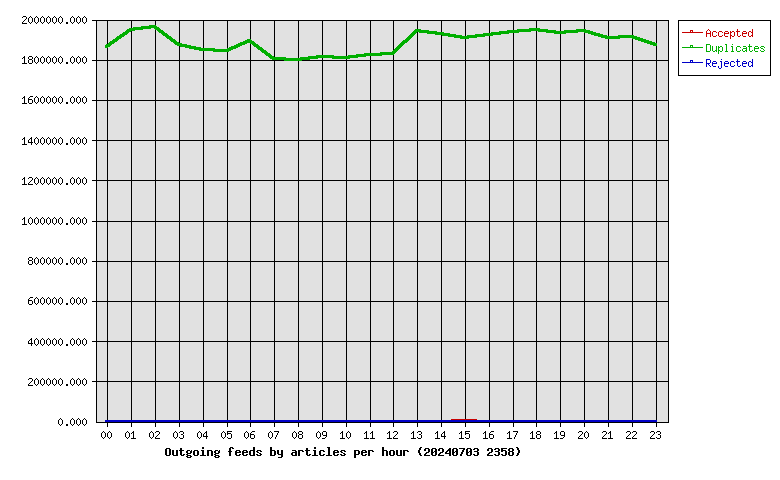
| Hour | Accepted | %Acc | Volume | %Vol | dups | Rejs |
|---|---|---|---|---|---|---|
| 00 | 0 | 0.00 | 0.00KB | 0.00 | 1864765 | 0 |
| 01 | 0 | 0.00 | 0.00KB | 0.00 | 1949059 | 0 |
| 02 | 0 | 0.00 | 0.00KB | 0.00 | 1962448 | 0 |
| 03 | 0 | 0.00 | 0.00KB | 0.00 | 1871841 | 0 |
| 04 | 0 | 0.00 | 0.00KB | 0.00 | 1847385 | 0 |
| 05 | 0 | 0.00 | 0.00KB | 0.00 | 1844523 | 0 |
| 06 | 0 | 0.00 | 0.00KB | 0.00 | 1894133 | 0 |
| 07 | 0 | 0.00 | 0.00KB | 0.00 | 1804574 | 0 |
| 08 | 0 | 0.00 | 0.00KB | 0.00 | 1798153 | 0 |
| 09 | 0 | 0.00 | 0.00KB | 0.00 | 1813115 | 0 |
| 10 | 0 | 0.00 | 0.00KB | 0.00 | 1810570 | 0 |
| 11 | 0 | 0.00 | 0.00KB | 0.00 | 1825252 | 0 |
| 12 | 0 | 0.00 | 0.00KB | 0.00 | 1829622 | 0 |
| 13 | 0 | 0.00 | 0.00KB | 0.00 | 1940822 | 0 |
| 14 | 0 | 0.00 | 0.00KB | 0.00 | 1927338 | 0 |
| 15 | 1 | 100.00 | 0.66KB | 100.00 | 1908301 | 0 |
| 16 | 0 | 0.00 | 0.00KB | 0.00 | 1920457 | 0 |
| 17 | 0 | 0.00 | 0.00KB | 0.00 | 1939558 | 0 |
| 18 | 0 | 0.00 | 0.00KB | 0.00 | 1947242 | 0 |
| 19 | 0 | 0.00 | 0.00KB | 0.00 | 1933725 | 0 |
| 20 | 0 | 0.00 | 0.00KB | 0.00 | 1942955 | 0 |
| 21 | 0 | 0.00 | 0.00KB | 0.00 | 1909601 | 0 |
| 22 | 0 | 0.00 | 0.00KB | 0.00 | 1912851 | 0 |
| 23 | 0 | 0.00 | 0.00KB | 0.00 | 1873769 | 0 |
| Total | 1 | 100.00 | 0.66KB | 100.00 | 45272059 | 0 |
 |
| >= 20% Full | >= 35% Full | >= 50% Full | >= 65% Full | >= 80% Full | >= 95% Full |
| Outgoing Feed | Batch Seq | Batch Num | Batch Max | %Full | Av. Pending |
|---|---|---|---|---|---|
| nbr.elbracht.net-o | 965888-965969 | 81 | 500 | 16 | 0.0 |
| text-spool-out | 0-0 | 0 | 500 | 0 | 0.0 |
| 1st Time | Last Time | # Msgs | Message |
|---|---|---|---|
| 08:33:23 | 08:33:24 | 2 | DNS Fwd/Rev mismatch: lookup of ns1.asiahostway.com failed |
| 13:41:16 | 1 | DNS Fwd/Rev mismatch: internettl.org/104.152.52.235 | |
| 13:41:57 | 1 | DNS Fwd/Rev mismatch: internettl.org/104.152.52.201 |