| |
DIABLO statistics for newsfeed.yoursite.com on Tue 02 Jul 2024 |
Generated on 20240702 2358 by feeder-stats v4.006. Copyright © 2002 The Diablo Project.
Diablo running processes:  87    Dnewslink running processes:  1


12:00AM  up 135 days,  7:19, 0 users, load averages: 8.76, 8.25, 7.96

Filesystem     Size    Used   Avail Capacity  Mounted on
/dev/da0s1g     94G    2.1G     84G     2%    /news
/dev/da1       7.3T    6.6T     76G    99%    /news2/spool/news/00
/dev/da2       7.3T    6.6T     76G    99%    /news2/spool/news/01
/dev/da3       3.7T    3.3T     82G    98%    /news2/spool/news/02
/dev/da4       5.5T      5T     56G    99%    /news2/spool/news/03
/dev/da8       7.3T    6.6T     72G    99%    /news2/spool/news/04
/dev/da9       7.3T    6.6T     75G    99%    /news2/spool/news/05
/dev/da10      7.3T    6.6T     76G    99%    /news2/spool/news/06
/dev/da11      5.5T      5T     81G    98%    /news2/spool/news/07
/dev/da12      5.5T      5T     60G    99%    /news2/spool/news/08
/dev/da13      7.3T    6.6T     77G    99%    /news2/spool/news/09
/dev/da14      7.3T    6.6T     78G    99%    /news2/spool/news/10
/dev/da15      7.3T    6.6T     77G    99%    /news2/spool/news/11
/dev/da16      7.3T    6.6T     75G    99%    /news2/spool/news/12
/dev/da17      7.3T    6.6T     75G    99%    /news2/spool/news/13
/dev/da18      7.3T    6.6T     72G    99%    /news2/spool/news/14
/dev/da19      7.3T    6.6T     75G    99%    /news2/spool/news/15
/dev/da20      7.3T    6.6T     79G    99%    /news2/spool/news/16
/dev/da21      7.3T    6.6T     73G    99%    /news2/spool/news/17
/dev/da22      7.3T    6.6T     78G    99%    /news2/spool/news/18
/dev/da23      7.3T    6.6T     75G    99%    /news2/spool/news/19
/dev/da24      7.3T    6.6T     78G    99%    /news2/spool/news/20
/dev/da25      7.3T    6.6T     76G    99%    /news2/spool/news/21
/dev/da26      7.3T    6.6T     73G    99%    /news2/spool/news/22
/dev/da5       221G     36G    166G    18%    /news1
/dev/md0        40G     15G     20G    43%    /news3
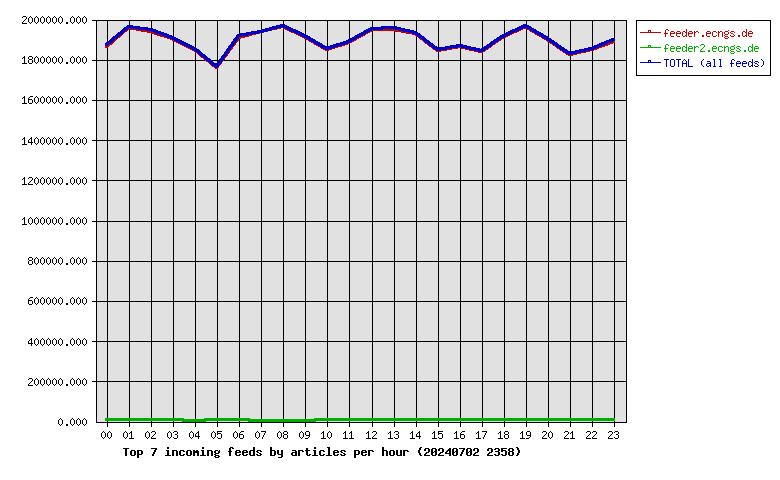
| Incoming Feed (+ Top1000 #) | Accepted | %Acc | %Tot | Art/sec | Volume | %Vol | KB/art | Check | Ihave | Spam | TooOld | Rejs | Errs | ||
|---|---|---|---|---|---|---|---|---|---|---|---|---|---|---|---|
| 1 | feeder.ecngs.de | 45425564 | 95.13 | 99.70 | 525.76 | 30.23TB | 100.00 | 714.55 | 46709058 | 0 | 0 | 0 | 1043122 | 0 | |
| 2 | feeder2.ecngs.de | 136510 | 76.66 | 0.30 | 1.58 | 1.46GB | 0.00 | 11.21 | 176966 | 0 | 0 | 0 | 1098 | 0 | |
| Total | 45562074 | 0.00 | 100.00 | 527.34 | 30.23TB | 100.00 | 712.45 | 46886024 | 0 | 0 | 0 | 1044220 | 0 | ||
 |
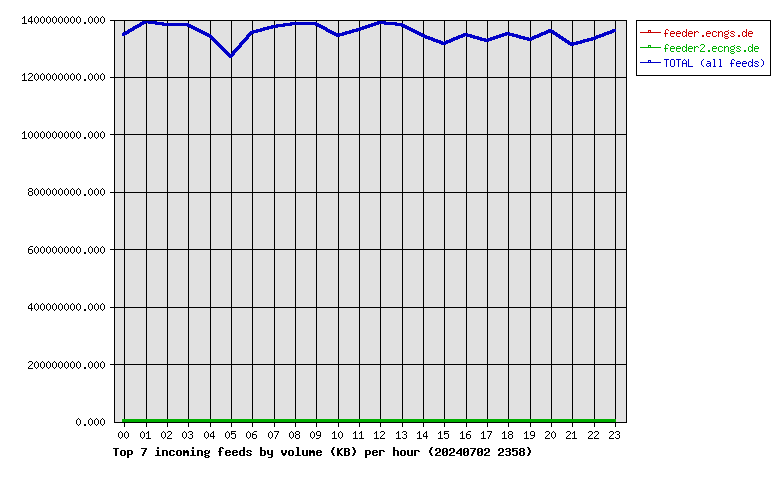
| Incoming Feed (+ Top1000 #) | Volume | %Vol | Kbps | Accepted | %Acc | %Tot | KB/art | Check | Ihave | Spam | TooOld | Rejs | Errs | ||
|---|---|---|---|---|---|---|---|---|---|---|---|---|---|---|---|
| 1 | feeder.ecngs.de | 30.23TB | 100.00 | 3005463.84 | 45425564 | 95.13 | 99.70 | 714.55 | 46709058 | 0 | 0 | 0 | 1043122 | 0 | |
| 2 | feeder2.ecngs.de | 1.46GB | 0.00 | 141.69 | 136510 | 76.66 | 0.30 | 11.21 | 176966 | 0 | 0 | 0 | 1098 | 0 | |
| Total | 30.23TB | 100.00 | 3005605.53 | 45562074 | 0.00 | 100.00 | 712.45 | 46886024 | 0 | 0 | 0 | 1044220 | 0 | ||
 |
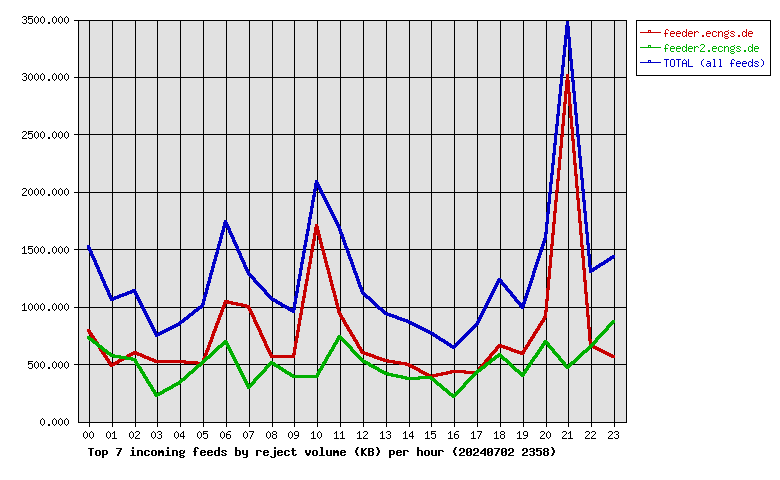
| Incoming Feed (+ Top1000 #) | Rej. Vol. | %Vol | Kbps | Accepted | %Acc | %Tot | KB/art | Check | Ihave | Spam | TooOld | Rejs | Errs | ||
|---|---|---|---|---|---|---|---|---|---|---|---|---|---|---|---|
| 1 | feeder.ecngs.de | 17.99MB | 60.80 | 1.71 | 45425564 | 95.13 | 99.70 | 714.55 | 46709058 | 0 | 0 | 0 | 1043122 | 0 | |
| 2 | feeder2.ecngs.de | 11.60MB | 39.20 | 1.10 | 136510 | 76.66 | 0.30 | 11.21 | 176966 | 0 | 0 | 0 | 1098 | 0 | |
| Total | 29.60MB | 100.00 | 2.81 | 45562074 | 0.00 | 100.00 | 712.45 | 46886024 | 0 | 0 | 0 | 1044220 | 0 | ||
 |
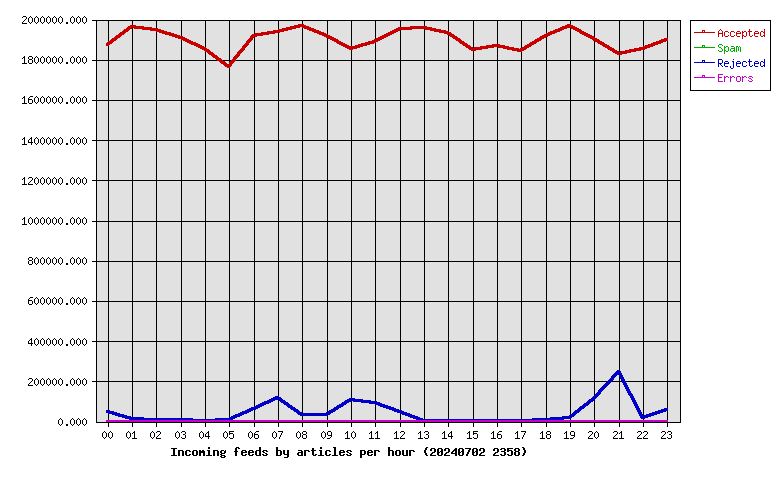
| Hour | Accepted | %Acc | Volume | %Vol | Check | Ihave | Spam | Rejs | Errs |
|---|---|---|---|---|---|---|---|---|---|
| 00 | 1871608 | 4.11 | 1.25TB | 4.15 | 1929293 | 0 | 0 | 47717 | 0 |
| 01 | 1965125 | 4.31 | 1.30TB | 4.29 | 1990686 | 0 | 0 | 14000 | 0 |
| 02 | 1945897 | 4.27 | 1.29TB | 4.25 | 1965012 | 0 | 0 | 9090 | 0 |
| 03 | 1906577 | 4.18 | 1.29TB | 4.25 | 1921308 | 0 | 0 | 6153 | 0 |
| 04 | 1855084 | 4.07 | 1.25TB | 4.14 | 1861838 | 0 | 0 | 76 | 0 |
| 05 | 1766042 | 3.88 | 1.18TB | 3.91 | 1845796 | 0 | 0 | 6893 | 0 |
| 06 | 1916193 | 4.21 | 1.26TB | 4.17 | 1988963 | 0 | 0 | 63047 | 0 |
| 07 | 1939499 | 4.26 | 1.28TB | 4.24 | 2064466 | 0 | 0 | 118708 | 0 |
| 08 | 1968211 | 4.32 | 1.29TB | 4.26 | 2003774 | 0 | 0 | 30287 | 0 |
| 09 | 1915535 | 4.20 | 1.29TB | 4.27 | 1957151 | 0 | 0 | 34074 | 0 |
| 10 | 1851278 | 4.06 | 1.25TB | 4.14 | 1969122 | 0 | 0 | 109073 | 0 |
| 11 | 1886724 | 4.14 | 1.27TB | 4.20 | 1988405 | 0 | 0 | 91665 | 0 |
| 12 | 1952218 | 4.28 | 1.29TB | 4.28 | 2007974 | 0 | 0 | 47126 | 0 |
| 13 | 1955236 | 4.29 | 1.29TB | 4.26 | 1967975 | 0 | 0 | 4424 | 0 |
| 14 | 1933484 | 4.24 | 1.25TB | 4.13 | 1940844 | 0 | 0 | 78 | 0 |
| 15 | 1847522 | 4.05 | 1.22TB | 4.05 | 1856710 | 0 | 0 | 72 | 0 |
| 16 | 1870467 | 4.11 | 1.26TB | 4.15 | 1879687 | 0 | 0 | 78 | 0 |
| 17 | 1843790 | 4.05 | 1.23TB | 4.08 | 1853233 | 0 | 0 | 911 | 0 |
| 18 | 1920302 | 4.21 | 1.26TB | 4.15 | 1935334 | 0 | 0 | 5453 | 0 |
| 19 | 1967301 | 4.32 | 1.24TB | 4.10 | 1991889 | 0 | 0 | 16924 | 0 |
| 20 | 1905363 | 4.18 | 1.27TB | 4.19 | 2028965 | 0 | 0 | 113355 | 0 |
| 21 | 1828382 | 4.01 | 1.22TB | 4.04 | 2086938 | 0 | 0 | 247767 | 0 |
| 22 | 1854233 | 4.07 | 1.24TB | 4.11 | 1885393 | 0 | 0 | 19424 | 0 |
| 23 | 1896003 | 4.16 | 1.27TB | 4.19 | 1965268 | 0 | 0 | 57825 | 0 |
| Total | 45562074 | 100.00 | 30.23TB | 100.00 | 46886024 | 0 | 0 | 1044220 | 0 |
 |
| Outgoing Feed (+ Top1000 #) | Accepted | %Acc | %Tot | Art/sec | Volume | %Vol | KB/art | Dups | Rejs | % Ratio (Out/In) | ||
|---|---|---|---|---|---|---|---|---|---|---|---|---|
| 1 | 217.73.144.40 | 0 | 0.00 | 0.00 | 0.00 | 0.00KB | 0.00 | 0.00 | 45107185 | 0 | … | |
| Total | 0 | 0.00 | 0.00 | 0.00 | 0.00KB | 0.00 | 0.00 | 45107185 | 0 | |||
 |
| Outgoing Feed (+ Top1000 #) | Volume | %Vol | Kbps | Accepted | %Acc | %Tot | KB/art | Dups | Rejs | % Ratio (Out/In) | ||
|---|---|---|---|---|---|---|---|---|---|---|---|---|
| 1 | 217.73.144.40 | 0.00KB | 0.00 | 0.00 | 0 | 0.00 | 0.00 | 0.00 | 45107185 | 0 | … | |
| Total | 0.00KB | 0.00 | 0.00 | 0 | 0.00 | 0.00 | 0.00 | 45107185 | 0 | |||
 |
| Outgoing Feed (+ Top1000 #) | Rej. Vol. | %Vol | Kbps | Accepted | %Acc | %Tot | KB/art | Dups | Rejs | % Ratio (Out/In) | ||
|---|---|---|---|---|---|---|---|---|---|---|---|---|
| 1 | 217.73.144.40 | 0.00KB | 0.00 | 0.00 | 0 | 0.00 | 0.00 | 0.00 | 45107185 | 0 | … | |
| Total | 0.00KB | 0.00 | 0.00 | 0 | 0.00 | 0.00 | 0.00 | 45107185 | 0 | |||
 |
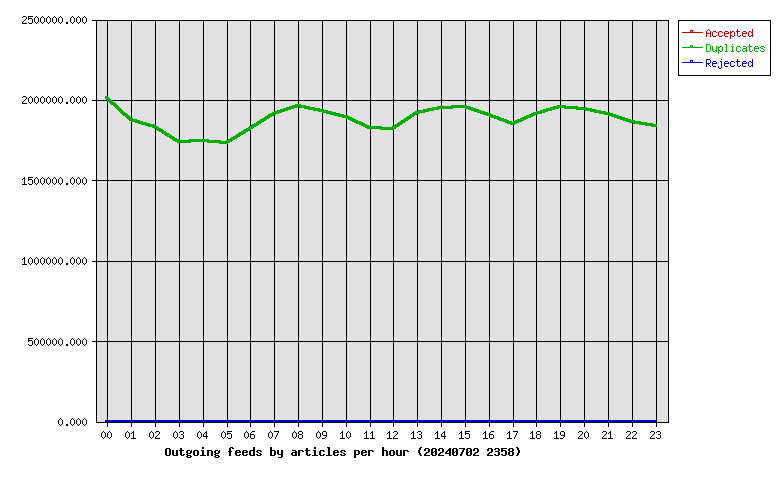
| Hour | Accepted | %Acc | Volume | %Vol | dups | Rejs |
|---|---|---|---|---|---|---|
| 00 | 0 | 0.00 | 0.00KB | 0.00 | 2014104 | 0 |
| 01 | 0 | 0.00 | 0.00KB | 0.00 | 1877102 | 0 |
| 02 | 0 | 0.00 | 0.00KB | 0.00 | 1831909 | 0 |
| 03 | 0 | 0.00 | 0.00KB | 0.00 | 1740794 | 0 |
| 04 | 0 | 0.00 | 0.00KB | 0.00 | 1744565 | 0 |
| 05 | 0 | 0.00 | 0.00KB | 0.00 | 1734650 | 0 |
| 06 | 0 | 0.00 | 0.00KB | 0.00 | 1818704 | 0 |
| 07 | 0 | 0.00 | 0.00KB | 0.00 | 1914676 | 0 |
| 08 | 0 | 0.00 | 0.00KB | 0.00 | 1960156 | 0 |
| 09 | 0 | 0.00 | 0.00KB | 0.00 | 1933189 | 0 |
| 10 | 0 | 0.00 | 0.00KB | 0.00 | 1893159 | 0 |
| 11 | 0 | 0.00 | 0.00KB | 0.00 | 1823976 | 0 |
| 12 | 0 | 0.00 | 0.00KB | 0.00 | 1821568 | 0 |
| 13 | 0 | 0.00 | 0.00KB | 0.00 | 1916460 | 0 |
| 14 | 0 | 0.00 | 0.00KB | 0.00 | 1947903 | 0 |
| 15 | 0 | 0.00 | 0.00KB | 0.00 | 1954919 | 0 |
| 16 | 0 | 0.00 | 0.00KB | 0.00 | 1905124 | 0 |
| 17 | 0 | 0.00 | 0.00KB | 0.00 | 1847976 | 0 |
| 18 | 0 | 0.00 | 0.00KB | 0.00 | 1910091 | 0 |
| 19 | 0 | 0.00 | 0.00KB | 0.00 | 1955742 | 0 |
| 20 | 0 | 0.00 | 0.00KB | 0.00 | 1943850 | 0 |
| 21 | 0 | 0.00 | 0.00KB | 0.00 | 1914739 | 0 |
| 22 | 0 | 0.00 | 0.00KB | 0.00 | 1861083 | 0 |
| 23 | 0 | 0.00 | 0.00KB | 0.00 | 1840746 | 0 |
| Total | 0 | 0.00 | 0.00KB | 0.00 | 45107185 | 0 |
 |
| >= 20% Full | >= 35% Full | >= 50% Full | >= 65% Full | >= 80% Full | >= 95% Full |
| Outgoing Feed | Batch Seq | Batch Num | Batch Max | %Full | Av. Pending |
|---|---|---|---|---|---|
| nbr.elbracht.net-o | 965599-965680 | 81 | 500 | 16 | 0.0 |
| text-spool-out | 0-0 | 0 | 500 | 0 | 0.0 |
| 1st Time | Last Time | # Msgs | Message |
|---|---|---|---|
| 16:30:49 | 16:30:56 | 3 | DNS Fwd/Rev mismatch: lookup of scanner-06.ch1.censys-scanner.com failed |