| |
DIABLO statistics for newsfeed.yoursite.com on Mon 01 Jul 2024 |
Generated on 20240701 2358 by feeder-stats v4.006. Copyright © 2002 The Diablo Project.
Diablo running processes:  89    Dnewslink running processes:  1


12:00AM  up 134 days,  7:19, 0 users, load averages: 10.55, 9.91, 9.73

Filesystem     Size    Used   Avail Capacity  Mounted on
/dev/da0s1g     94G    2.0G     84G     2%    /news
/dev/da1       7.3T    6.7T     37G    99%    /news2/spool/news/00
/dev/da2       7.3T    6.7T     39G    99%    /news2/spool/news/01
/dev/da3       3.7T    3.3T     45G    99%    /news2/spool/news/02
/dev/da4       5.5T      5T     67G    99%    /news2/spool/news/03
/dev/da8       7.3T    6.6T     88G    99%    /news2/spool/news/04
/dev/da9       7.3T    6.6T     90G    99%    /news2/spool/news/05
/dev/da10      7.3T    6.6T     89G    99%    /news2/spool/news/06
/dev/da11      5.5T      5T     47G    99%    /news2/spool/news/07
/dev/da12      5.5T      5T     75G    99%    /news2/spool/news/08
/dev/da13      7.3T    6.7T     38G    99%    /news2/spool/news/09
/dev/da14      7.3T    6.7T     39G    99%    /news2/spool/news/10
/dev/da15      7.3T    6.7T     39G    99%    /news2/spool/news/11
/dev/da16      7.3T    6.6T     90G    99%    /news2/spool/news/12
/dev/da17      7.3T    6.7T     38G    99%    /news2/spool/news/13
/dev/da18      7.3T    6.6T     86G    99%    /news2/spool/news/14
/dev/da19      7.3T    6.6T     90G    99%    /news2/spool/news/15
/dev/da20      7.3T    6.6T     92G    99%    /news2/spool/news/16
/dev/da21      7.3T    6.6T     90G    99%    /news2/spool/news/17
/dev/da22      7.3T    6.7T     38G    99%    /news2/spool/news/18
/dev/da23      7.3T    6.6T     91G    99%    /news2/spool/news/19
/dev/da24      7.3T    6.7T     39G    99%    /news2/spool/news/20
/dev/da25      7.3T    6.6T     89G    99%    /news2/spool/news/21
/dev/da26      7.3T    6.6T     89G    99%    /news2/spool/news/22
/dev/da5       221G     36G    167G    18%    /news1
/dev/md0        40G     15G     20G    43%    /news3
| Incoming Feed (+ Top1000 #) | Accepted | %Acc | %Tot | Art/sec | Volume | %Vol | KB/art | Check | Ihave | Spam | TooOld | Rejs | Errs | ||
|---|---|---|---|---|---|---|---|---|---|---|---|---|---|---|---|
| 1 | feeder.ecngs.de | 44739571 | 91.69 | 99.68 | 517.82 | 29.79TB | 100.00 | 715.06 | 46896389 | 0 | 0 | 0 | 1896048 | 0 | |
| 2 | feeder2.ecngs.de | 143224 | 74.84 | 0.32 | 1.66 | 1.42GB | 0.00 | 10.40 | 190134 | 0 | 0 | 0 | 1245 | 0 | |
| Total | 44882795 | 0.00 | 100.00 | 519.48 | 29.80TB | 100.00 | 712.81 | 47086523 | 0 | 0 | 0 | 1897293 | 0 | ||
 |
| Incoming Feed (+ Top1000 #) | Volume | %Vol | Kbps | Accepted | %Acc | %Tot | KB/art | Check | Ihave | Spam | TooOld | Rejs | Errs | ||
|---|---|---|---|---|---|---|---|---|---|---|---|---|---|---|---|
| 1 | feeder.ecngs.de | 29.79TB | 100.00 | 2962188.18 | 44739571 | 91.69 | 99.68 | 715.06 | 46896389 | 0 | 0 | 0 | 1896048 | 0 | |
| 2 | feeder2.ecngs.de | 1.42GB | 0.00 | 138.03 | 143224 | 74.84 | 0.32 | 10.40 | 190134 | 0 | 0 | 0 | 1245 | 0 | |
| Total | 29.80TB | 100.00 | 2962326.21 | 44882795 | 0.00 | 100.00 | 712.81 | 47086523 | 0 | 0 | 0 | 1897293 | 0 | ||
 |
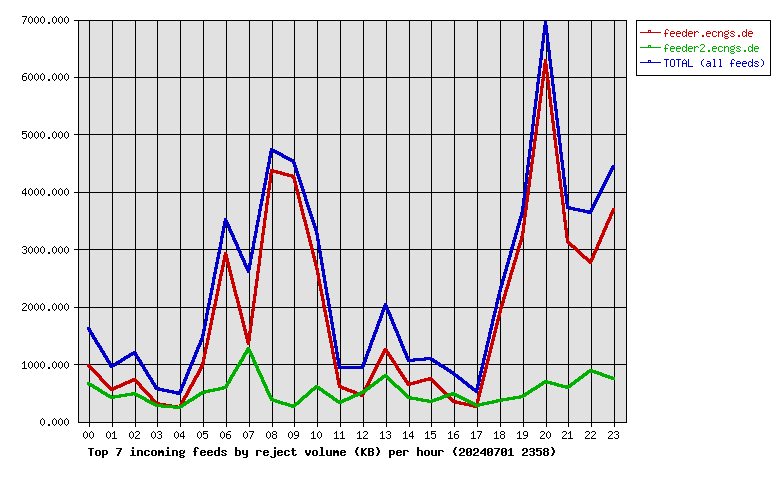
| Incoming Feed (+ Top1000 #) | Rej. Vol. | %Vol | Kbps | Accepted | %Acc | %Tot | KB/art | Check | Ihave | Spam | TooOld | Rejs | Errs | ||
|---|---|---|---|---|---|---|---|---|---|---|---|---|---|---|---|
| 1 | feeder.ecngs.de | 43.47MB | 78.22 | 4.12 | 44739571 | 91.69 | 99.68 | 715.06 | 46896389 | 0 | 0 | 0 | 1896048 | 0 | |
| 2 | feeder2.ecngs.de | 12.11MB | 21.78 | 1.15 | 143224 | 74.84 | 0.32 | 10.40 | 190134 | 0 | 0 | 0 | 1245 | 0 | |
| Total | 55.58MB | 100.00 | 5.27 | 44882795 | 0.00 | 100.00 | 712.81 | 47086523 | 0 | 0 | 0 | 1897293 | 0 | ||
 |
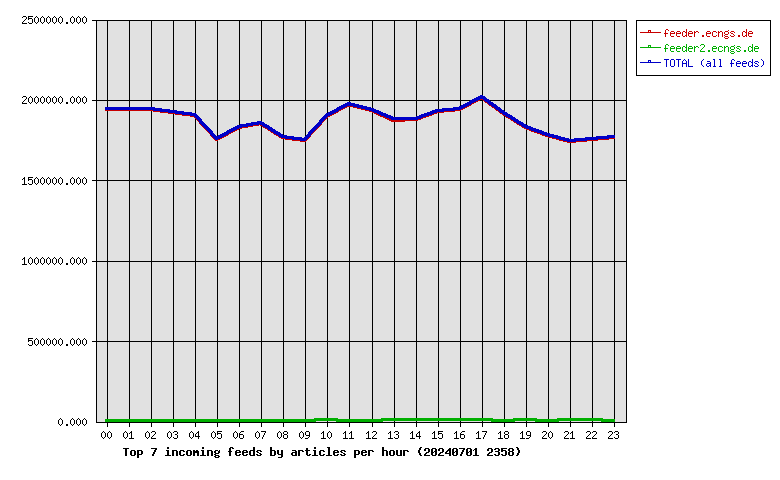
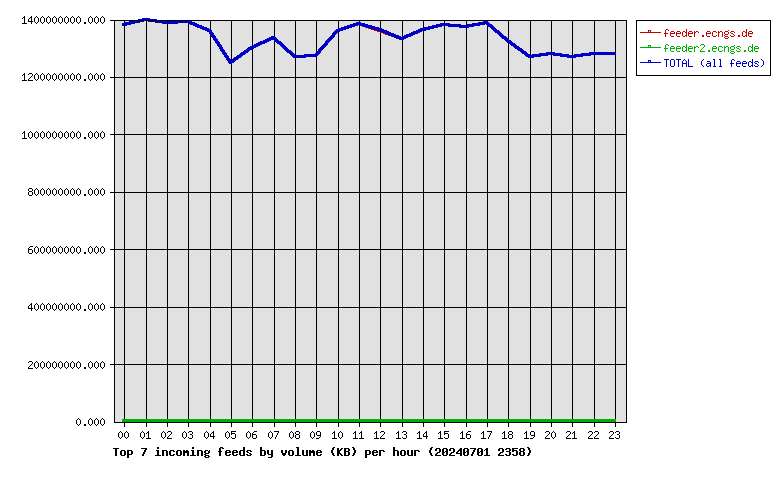
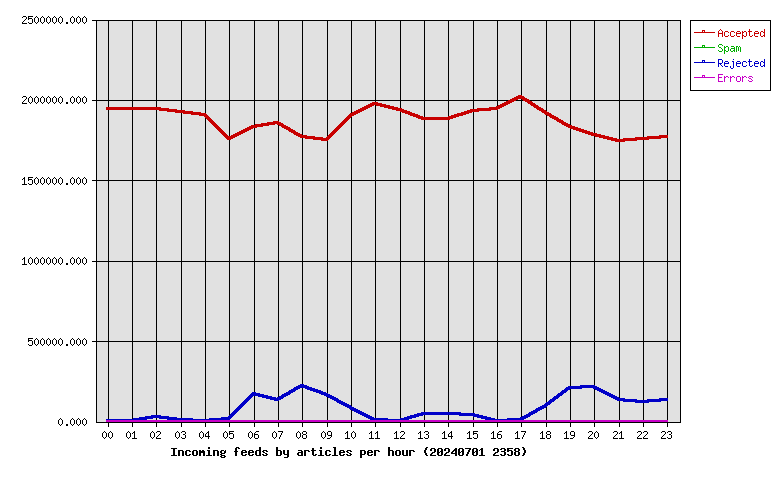
| Hour | Accepted | %Acc | Volume | %Vol | Check | Ihave | Spam | Rejs | Errs |
|---|---|---|---|---|---|---|---|---|---|
| 00 | 1943250 | 4.33 | 1.29TB | 4.31 | 1955729 | 0 | 0 | 2639 | 0 |
| 01 | 1944805 | 4.33 | 1.30TB | 4.37 | 1953406 | 0 | 0 | 741 | 0 |
| 02 | 1942835 | 4.33 | 1.29TB | 4.34 | 1978846 | 0 | 0 | 28668 | 0 |
| 03 | 1925746 | 4.29 | 1.30TB | 4.35 | 1942256 | 0 | 0 | 9526 | 0 |
| 04 | 1906635 | 4.25 | 1.27TB | 4.25 | 1913132 | 0 | 0 | 63 | 0 |
| 05 | 1757805 | 3.92 | 1.16TB | 3.90 | 1851568 | 0 | 0 | 15984 | 0 |
| 06 | 1830251 | 4.08 | 1.21TB | 4.07 | 2008610 | 0 | 0 | 169618 | 0 |
| 07 | 1854871 | 4.13 | 1.24TB | 4.17 | 1996715 | 0 | 0 | 131599 | 0 |
| 08 | 1767338 | 3.94 | 1.18TB | 3.97 | 1998245 | 0 | 0 | 223816 | 0 |
| 09 | 1749468 | 3.90 | 1.19TB | 3.98 | 1925776 | 0 | 0 | 166365 | 0 |
| 10 | 1898679 | 4.23 | 1.27TB | 4.25 | 1993423 | 0 | 0 | 84066 | 0 |
| 11 | 1976851 | 4.40 | 1.29TB | 4.33 | 1993184 | 0 | 0 | 7834 | 0 |
| 12 | 1934707 | 4.31 | 1.27TB | 4.26 | 1943097 | 0 | 0 | 255 | 0 |
| 13 | 1878227 | 4.18 | 1.24TB | 4.16 | 1937787 | 0 | 0 | 44152 | 0 |
| 14 | 1882406 | 4.19 | 1.27TB | 4.26 | 1940554 | 0 | 0 | 46414 | 0 |
| 15 | 1929779 | 4.30 | 1.29TB | 4.31 | 1979229 | 0 | 0 | 38637 | 0 |
| 16 | 1943823 | 4.33 | 1.28TB | 4.29 | 1964603 | 0 | 0 | 6036 | 0 |
| 17 | 2015342 | 4.49 | 1.29TB | 4.34 | 2033266 | 0 | 0 | 7899 | 0 |
| 18 | 1917152 | 4.27 | 1.23TB | 4.14 | 2020812 | 0 | 0 | 93514 | 0 |
| 19 | 1828699 | 4.07 | 1.18TB | 3.97 | 2046578 | 0 | 0 | 207803 | 0 |
| 20 | 1782265 | 3.97 | 1.19TB | 4.00 | 2009565 | 0 | 0 | 217348 | 0 |
| 21 | 1742601 | 3.88 | 1.18TB | 3.97 | 1890801 | 0 | 0 | 135882 | 0 |
| 22 | 1758213 | 3.92 | 1.19TB | 4.00 | 1891618 | 0 | 0 | 122074 | 0 |
| 23 | 1771047 | 3.95 | 1.19TB | 4.00 | 1917723 | 0 | 0 | 136360 | 0 |
| Total | 44882795 | 100.00 | 29.80TB | 100.00 | 47086523 | 0 | 0 | 1897293 | 0 |
 |
| Outgoing Feed (+ Top1000 #) | Accepted | %Acc | %Tot | Art/sec | Volume | %Vol | KB/art | Dups | Rejs | % Ratio (Out/In) | ||
|---|---|---|---|---|---|---|---|---|---|---|---|---|
| 1 | 217.73.144.40 | 0 | 0.00 | 0.00 | 0.00 | 0.00KB | 0.00 | 0.00 | 45300259 | 0 | … | |
| Total | 0 | 0.00 | 0.00 | 0.00 | 0.00KB | 0.00 | 0.00 | 45300259 | 0 | |||
 |
| Outgoing Feed (+ Top1000 #) | Volume | %Vol | Kbps | Accepted | %Acc | %Tot | KB/art | Dups | Rejs | % Ratio (Out/In) | ||
|---|---|---|---|---|---|---|---|---|---|---|---|---|
| 1 | 217.73.144.40 | 0.00KB | 0.00 | 0.00 | 0 | 0.00 | 0.00 | 0.00 | 45300259 | 0 | … | |
| Total | 0.00KB | 0.00 | 0.00 | 0 | 0.00 | 0.00 | 0.00 | 45300259 | 0 | |||
 |
| Outgoing Feed (+ Top1000 #) | Rej. Vol. | %Vol | Kbps | Accepted | %Acc | %Tot | KB/art | Dups | Rejs | % Ratio (Out/In) | ||
|---|---|---|---|---|---|---|---|---|---|---|---|---|
| 1 | 217.73.144.40 | 0.00KB | 0.00 | 0.00 | 0 | 0.00 | 0.00 | 0.00 | 45300259 | 0 | … | |
| Total | 0.00KB | 0.00 | 0.00 | 0 | 0.00 | 0.00 | 0.00 | 45300259 | 0 | |||
 |
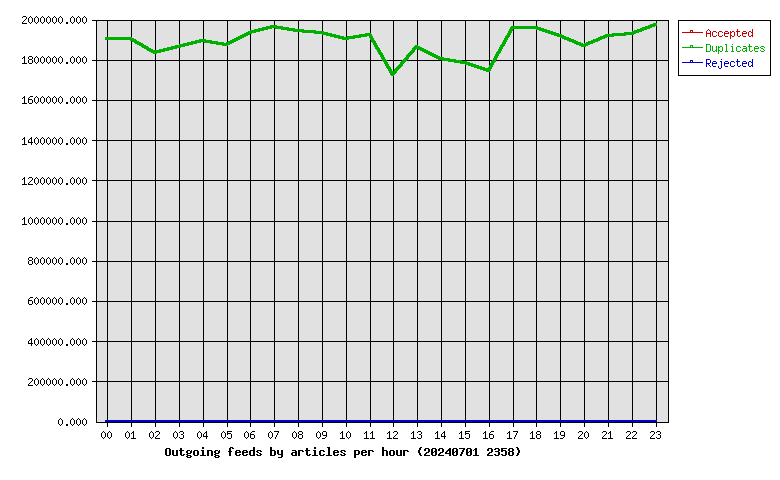
| Hour | Accepted | %Acc | Volume | %Vol | dups | Rejs |
|---|---|---|---|---|---|---|
| 00 | 0 | 0.00 | 0.00KB | 0.00 | 1905279 | 0 |
| 01 | 0 | 0.00 | 0.00KB | 0.00 | 1903267 | 0 |
| 02 | 0 | 0.00 | 0.00KB | 0.00 | 1831624 | 0 |
| 03 | 0 | 0.00 | 0.00KB | 0.00 | 1862426 | 0 |
| 04 | 0 | 0.00 | 0.00KB | 0.00 | 1891235 | 0 |
| 05 | 0 | 0.00 | 0.00KB | 0.00 | 1873307 | 0 |
| 06 | 0 | 0.00 | 0.00KB | 0.00 | 1933919 | 0 |
| 07 | 0 | 0.00 | 0.00KB | 0.00 | 1960784 | 0 |
| 08 | 0 | 0.00 | 0.00KB | 0.00 | 1942694 | 0 |
| 09 | 0 | 0.00 | 0.00KB | 0.00 | 1934689 | 0 |
| 10 | 0 | 0.00 | 0.00KB | 0.00 | 1901084 | 0 |
| 11 | 0 | 0.00 | 0.00KB | 0.00 | 1921495 | 0 |
| 12 | 0 | 0.00 | 0.00KB | 0.00 | 1725789 | 0 |
| 13 | 0 | 0.00 | 0.00KB | 0.00 | 1864108 | 0 |
| 14 | 0 | 0.00 | 0.00KB | 0.00 | 1802174 | 0 |
| 15 | 0 | 0.00 | 0.00KB | 0.00 | 1785150 | 0 |
| 16 | 0 | 0.00 | 0.00KB | 0.00 | 1745343 | 0 |
| 17 | 0 | 0.00 | 0.00KB | 0.00 | 1956873 | 0 |
| 18 | 0 | 0.00 | 0.00KB | 0.00 | 1955319 | 0 |
| 19 | 0 | 0.00 | 0.00KB | 0.00 | 1918580 | 0 |
| 20 | 0 | 0.00 | 0.00KB | 0.00 | 1868297 | 0 |
| 21 | 0 | 0.00 | 0.00KB | 0.00 | 1916776 | 0 |
| 22 | 0 | 0.00 | 0.00KB | 0.00 | 1927782 | 0 |
| 23 | 0 | 0.00 | 0.00KB | 0.00 | 1972265 | 0 |
| Total | 0 | 0.00 | 0.00KB | 0.00 | 45300259 | 0 |
 |
| >= 20% Full | >= 35% Full | >= 50% Full | >= 65% Full | >= 80% Full | >= 95% Full |
| Outgoing Feed | Batch Seq | Batch Num | Batch Max | %Full | Av. Pending |
|---|---|---|---|---|---|
| nbr.elbracht.net-o | 965312-965393 | 81 | 500 | 16 | 0.0 |
| text-spool-out | 0-0 | 0 | 500 | 0 | 0.0 |
| 1st Time | Last Time | # Msgs | Message |
|---|---|---|---|
| 20:21:26 | 20:23:10 | 27 | DNS Fwd/Rev mismatch: academyforinternetresearch.org/109.74.204.123 |
| 21:26:12 | 1 | DNS Fwd/Rev mismatch: visit.keznews.com/194.165.16.72 |