| |
DIABLO statistics for newsfeed.yoursite.com on Sun 30 Jun 2024 |
Generated on 20240630 2358 by feeder-stats v4.006. Copyright © 2002 The Diablo Project.
Diablo running processes:  88    Dnewslink running processes:  1


12:00AM  up 133 days,  7:19, 0 users, load averages: 8.65, 7.97, 7.38

Filesystem     Size    Used   Avail Capacity  Mounted on
/dev/da0s1g     94G    2.1G     84G     2%    /news
/dev/da1       7.3T    6.7T     39G    99%    /news2/spool/news/00
/dev/da2       7.3T    6.7T     42G    99%    /news2/spool/news/01
/dev/da3       3.7T    3.3T     58G    98%    /news2/spool/news/02
/dev/da4       5.5T      5T     76G    99%    /news2/spool/news/03
/dev/da8       7.3T    6.7T     37G    99%    /news2/spool/news/04
/dev/da9       7.3T    6.7T     38G    99%    /news2/spool/news/05
/dev/da10      7.3T    6.7T     38G    99%    /news2/spool/news/06
/dev/da11      5.5T      5T     86G    98%    /news2/spool/news/07
/dev/da12      5.5T      5T     75G    99%    /news2/spool/news/08
/dev/da13      7.3T    6.7T     42G    99%    /news2/spool/news/09
/dev/da14      7.3T    6.7T     41G    99%    /news2/spool/news/10
/dev/da15      7.3T    6.7T     43G    99%    /news2/spool/news/11
/dev/da16      7.3T    6.7T     39G    99%    /news2/spool/news/12
/dev/da17      7.3T    6.7T     43G    99%    /news2/spool/news/13
/dev/da18      7.3T    6.7T     36G    99%    /news2/spool/news/14
/dev/da19      7.3T    6.6T     94G    99%    /news2/spool/news/15
/dev/da20      7.3T    6.7T     38G    99%    /news2/spool/news/16
/dev/da21      7.3T    6.6T     94G    99%    /news2/spool/news/17
/dev/da22      7.3T    6.7T     41G    99%    /news2/spool/news/18
/dev/da23      7.3T    6.7T     39G    99%    /news2/spool/news/19
/dev/da24      7.3T    6.7T     43G    99%    /news2/spool/news/20
/dev/da25      7.3T    6.6T     94G    99%    /news2/spool/news/21
/dev/da26      7.3T    6.7T     38G    99%    /news2/spool/news/22
/dev/da5       221G     36G    167G    18%    /news1
/dev/md0        40G     15G     20G    43%    /news3
| Incoming Feed (+ Top1000 #) | Accepted | %Acc | %Tot | Art/sec | Volume | %Vol | KB/art | Check | Ihave | Spam | TooOld | Rejs | Errs | ||
|---|---|---|---|---|---|---|---|---|---|---|---|---|---|---|---|
| 1 | feeder.ecngs.de | 44632176 | 89.56 | 99.67 | 516.58 | 29.91TB | 99.99 | 719.61 | 47397159 | 0 | 0 | 0 | 2437491 | 0 | |
| 2 | feeder2.ecngs.de | 148614 | 75.97 | 0.33 | 1.73 | 1.57GB | 0.01 | 11.04 | 194391 | 0 | 0 | 0 | 1222 | 0 | |
| Total | 44780790 | 0.00 | 100.00 | 518.30 | 29.91TB | 100.00 | 717.26 | 47591550 | 0 | 0 | 0 | 2438713 | 0 | ||
 |
| Incoming Feed (+ Top1000 #) | Volume | %Vol | Kbps | Accepted | %Acc | %Tot | KB/art | Check | Ihave | Spam | TooOld | Rejs | Errs | ||
|---|---|---|---|---|---|---|---|---|---|---|---|---|---|---|---|
| 1 | feeder.ecngs.de | 29.91TB | 99.99 | 2973874.78 | 44632176 | 89.56 | 99.67 | 719.61 | 47397159 | 0 | 0 | 0 | 2437491 | 0 | |
| 2 | feeder2.ecngs.de | 1.57GB | 0.01 | 152.57 | 148614 | 75.97 | 0.33 | 11.04 | 194391 | 0 | 0 | 0 | 1222 | 0 | |
| Total | 29.91TB | 100.00 | 2974027.34 | 44780790 | 0.00 | 100.00 | 717.26 | 47591550 | 0 | 0 | 0 | 2438713 | 0 | ||
 |
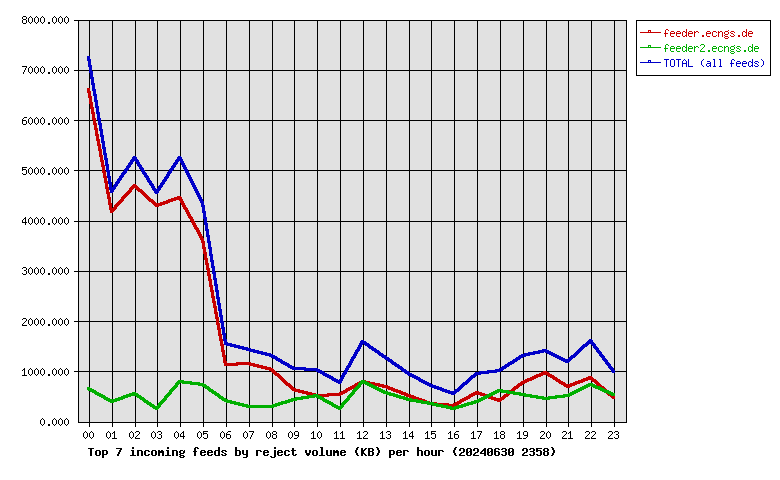
| Incoming Feed (+ Top1000 #) | Rej. Vol. | %Vol | Kbps | Accepted | %Acc | %Tot | KB/art | Check | Ihave | Spam | TooOld | Rejs | Errs | ||
|---|---|---|---|---|---|---|---|---|---|---|---|---|---|---|---|
| 1 | feeder.ecngs.de | 39.21MB | 77.57 | 3.72 | 44632176 | 89.56 | 99.67 | 719.61 | 47397159 | 0 | 0 | 0 | 2437491 | 0 | |
| 2 | feeder2.ecngs.de | 11.34MB | 22.43 | 1.08 | 148614 | 75.97 | 0.33 | 11.04 | 194391 | 0 | 0 | 0 | 1222 | 0 | |
| Total | 50.55MB | 100.00 | 4.80 | 44780790 | 0.00 | 100.00 | 717.26 | 47591550 | 0 | 0 | 0 | 2438713 | 0 | ||
 |
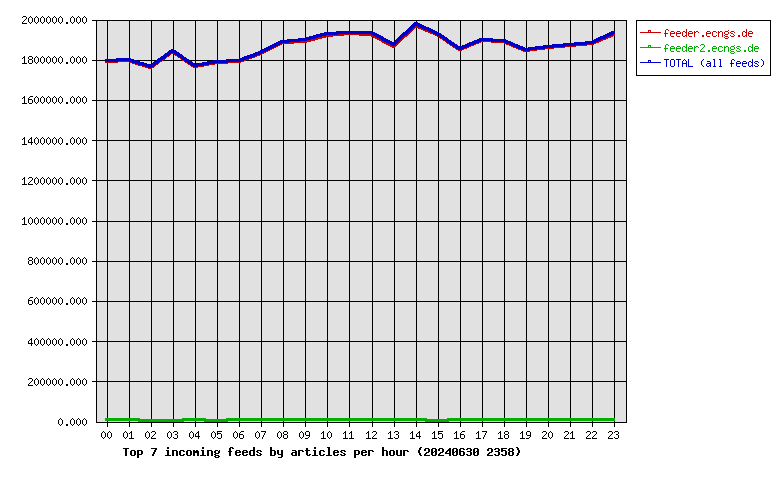
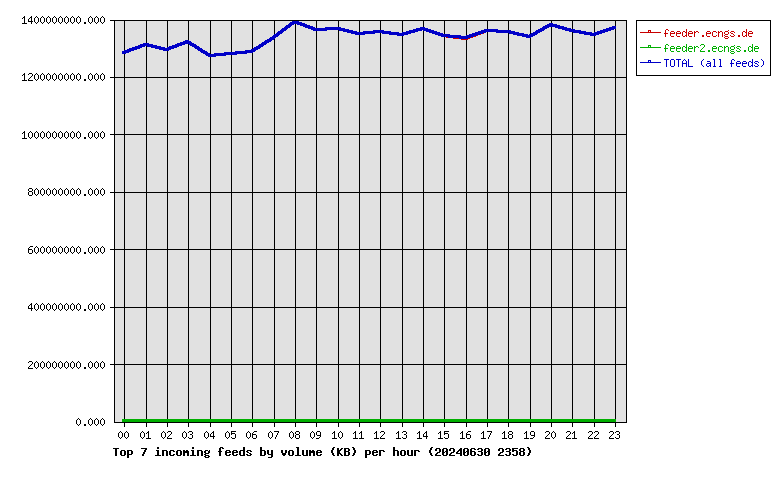
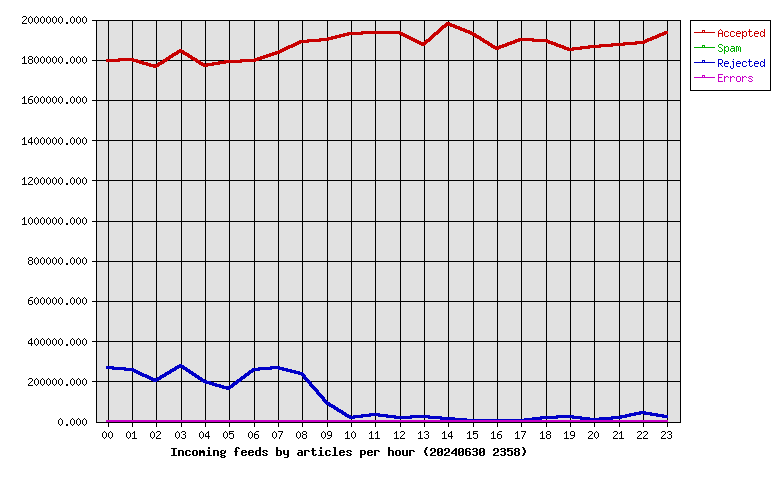
| Hour | Accepted | %Acc | Volume | %Vol | Check | Ihave | Spam | Rejs | Errs |
|---|---|---|---|---|---|---|---|---|---|
| 00 | 1794849 | 4.01 | 1.19TB | 3.99 | 2075126 | 0 | 0 | 265853 | 0 |
| 01 | 1799264 | 4.02 | 1.22TB | 4.08 | 2066901 | 0 | 0 | 257085 | 0 |
| 02 | 1764262 | 3.94 | 1.20TB | 4.03 | 1976028 | 0 | 0 | 203525 | 0 |
| 03 | 1843579 | 4.12 | 1.23TB | 4.12 | 2127591 | 0 | 0 | 275739 | 0 |
| 04 | 1770659 | 3.95 | 1.19TB | 3.97 | 1980663 | 0 | 0 | 198619 | 0 |
| 05 | 1787455 | 3.99 | 1.19TB | 3.99 | 2089624 | 0 | 0 | 160792 | 0 |
| 06 | 1792368 | 4.00 | 1.20TB | 4.01 | 2055075 | 0 | 0 | 254459 | 0 |
| 07 | 1832510 | 4.09 | 1.25TB | 4.16 | 2105534 | 0 | 0 | 266097 | 0 |
| 08 | 1886605 | 4.21 | 1.29TB | 4.33 | 2131255 | 0 | 0 | 237254 | 0 |
| 09 | 1895662 | 4.23 | 1.27TB | 4.24 | 1996536 | 0 | 0 | 91358 | 0 |
| 10 | 1926102 | 4.30 | 1.27TB | 4.26 | 1955085 | 0 | 0 | 19217 | 0 |
| 11 | 1933804 | 4.32 | 1.26TB | 4.20 | 1974378 | 0 | 0 | 31132 | 0 |
| 12 | 1930546 | 4.31 | 1.26TB | 4.23 | 1964842 | 0 | 0 | 19347 | 0 |
| 13 | 1871316 | 4.18 | 1.25TB | 4.19 | 1904905 | 0 | 0 | 21342 | 0 |
| 14 | 1976729 | 4.41 | 1.27TB | 4.26 | 1998235 | 0 | 0 | 10893 | 0 |
| 15 | 1927108 | 4.30 | 1.25TB | 4.18 | 1933690 | 0 | 0 | 257 | 0 |
| 16 | 1854916 | 4.14 | 1.24TB | 4.15 | 1863339 | 0 | 0 | 243 | 0 |
| 17 | 1898955 | 4.24 | 1.27TB | 4.23 | 1911914 | 0 | 0 | 108 | 0 |
| 18 | 1891972 | 4.22 | 1.26TB | 4.22 | 1917930 | 0 | 0 | 16319 | 0 |
| 19 | 1846759 | 4.12 | 1.25TB | 4.17 | 1878973 | 0 | 0 | 24473 | 0 |
| 20 | 1864922 | 4.16 | 1.28TB | 4.29 | 1880412 | 0 | 0 | 5991 | 0 |
| 21 | 1873510 | 4.18 | 1.27TB | 4.23 | 1899995 | 0 | 0 | 17269 | 0 |
| 22 | 1884859 | 4.21 | 1.25TB | 4.19 | 1939010 | 0 | 0 | 41192 | 0 |
| 23 | 1932079 | 4.31 | 1.28TB | 4.27 | 1964509 | 0 | 0 | 20149 | 0 |
| Total | 44780790 | 100.00 | 29.91TB | 100.00 | 47591550 | 0 | 0 | 2438713 | 0 |
 |
| Outgoing Feed (+ Top1000 #) | Accepted | %Acc | %Tot | Art/sec | Volume | %Vol | KB/art | Dups | Rejs | % Ratio (Out/In) | ||
|---|---|---|---|---|---|---|---|---|---|---|---|---|
| 1 | 217.73.144.40 | 0 | 0.00 | 0.00 | 0.00 | 0.00KB | 0.00 | 0.00 | 44571549 | 0 | … | |
| Total | 0 | 0.00 | 0.00 | 0.00 | 0.00KB | 0.00 | 0.00 | 44571549 | 0 | |||
 |
| Outgoing Feed (+ Top1000 #) | Volume | %Vol | Kbps | Accepted | %Acc | %Tot | KB/art | Dups | Rejs | % Ratio (Out/In) | ||
|---|---|---|---|---|---|---|---|---|---|---|---|---|
| 1 | 217.73.144.40 | 0.00KB | 0.00 | 0.00 | 0 | 0.00 | 0.00 | 0.00 | 44571549 | 0 | … | |
| Total | 0.00KB | 0.00 | 0.00 | 0 | 0.00 | 0.00 | 0.00 | 44571549 | 0 | |||
 |
| Outgoing Feed (+ Top1000 #) | Rej. Vol. | %Vol | Kbps | Accepted | %Acc | %Tot | KB/art | Dups | Rejs | % Ratio (Out/In) | ||
|---|---|---|---|---|---|---|---|---|---|---|---|---|
| 1 | 217.73.144.40 | 0.00KB | 0.00 | 0.00 | 0 | 0.00 | 0.00 | 0.00 | 44571549 | 0 | … | |
| Total | 0.00KB | 0.00 | 0.00 | 0 | 0.00 | 0.00 | 0.00 | 44571549 | 0 | |||
 |
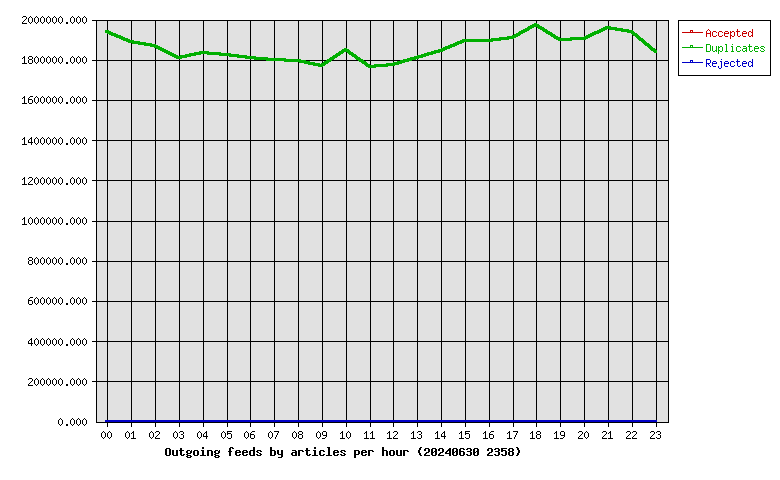
| Hour | Accepted | %Acc | Volume | %Vol | dups | Rejs |
|---|---|---|---|---|---|---|
| 00 | 0 | 0.00 | 0.00KB | 0.00 | 1939349 | 0 |
| 01 | 0 | 0.00 | 0.00KB | 0.00 | 1889378 | 0 |
| 02 | 0 | 0.00 | 0.00KB | 0.00 | 1868571 | 0 |
| 03 | 0 | 0.00 | 0.00KB | 0.00 | 1809043 | 0 |
| 04 | 0 | 0.00 | 0.00KB | 0.00 | 1834386 | 0 |
| 05 | 0 | 0.00 | 0.00KB | 0.00 | 1823122 | 0 |
| 06 | 0 | 0.00 | 0.00KB | 0.00 | 1806747 | 0 |
| 07 | 0 | 0.00 | 0.00KB | 0.00 | 1799693 | 0 |
| 08 | 0 | 0.00 | 0.00KB | 0.00 | 1795365 | 0 |
| 09 | 0 | 0.00 | 0.00KB | 0.00 | 1766176 | 0 |
| 10 | 0 | 0.00 | 0.00KB | 0.00 | 1848191 | 0 |
| 11 | 0 | 0.00 | 0.00KB | 0.00 | 1765713 | 0 |
| 12 | 0 | 0.00 | 0.00KB | 0.00 | 1775454 | 0 |
| 13 | 0 | 0.00 | 0.00KB | 0.00 | 1808441 | 0 |
| 14 | 0 | 0.00 | 0.00KB | 0.00 | 1841288 | 0 |
| 15 | 0 | 0.00 | 0.00KB | 0.00 | 1893958 | 0 |
| 16 | 0 | 0.00 | 0.00KB | 0.00 | 1892829 | 0 |
| 17 | 0 | 0.00 | 0.00KB | 0.00 | 1909473 | 0 |
| 18 | 0 | 0.00 | 0.00KB | 0.00 | 1971729 | 0 |
| 19 | 0 | 0.00 | 0.00KB | 0.00 | 1897711 | 0 |
| 20 | 0 | 0.00 | 0.00KB | 0.00 | 1904693 | 0 |
| 21 | 0 | 0.00 | 0.00KB | 0.00 | 1955665 | 0 |
| 22 | 0 | 0.00 | 0.00KB | 0.00 | 1938025 | 0 |
| 23 | 0 | 0.00 | 0.00KB | 0.00 | 1836549 | 0 |
| Total | 0 | 0.00 | 0.00KB | 0.00 | 44571549 | 0 |
 |
| >= 20% Full | >= 35% Full | >= 50% Full | >= 65% Full | >= 80% Full | >= 95% Full |
| Outgoing Feed | Batch Seq | Batch Num | Batch Max | %Full | Av. Pending |
|---|---|---|---|---|---|
| nbr.elbracht.net-o | 965023-965104 | 81 | 500 | 16 | 0.0 |
| text-spool-out | 0-0 | 0 | 500 | 0 | 0.0 |
| 1st Time | Last Time | # Msgs | Message |
|---|---|---|---|
| 14:05:34 | 14:05:41 | 3 | DNS Fwd/Rev mismatch: lookup of scanner-25.ch1.censys-scanner.com failed |
| 09:55:48 | 09:55:52 | 2 | DNS Fwd/Rev mismatch: lookup of unused-space.coop.net failed |