| |
DIABLO statistics for newsfeed.yoursite.com on Sat 29 Jun 2024 |
Generated on 20240629 2358 by feeder-stats v4.006. Copyright © 2002 The Diablo Project.
Diablo running processes:  91    Dnewslink running processes:  1


12:00AM  up 132 days,  7:19, 0 users, load averages: 13.21, 10.96, 10.46

Filesystem     Size    Used   Avail Capacity  Mounted on
/dev/da0s1g     94G    2.1G     84G     2%    /news
/dev/da1       7.3T    6.6T     74G    99%    /news2/spool/news/00
/dev/da2       7.3T    6.6T     77G    99%    /news2/spool/news/01
/dev/da3       3.7T    3.3T     43G    99%    /news2/spool/news/02
/dev/da4       5.5T      5T     61G    99%    /news2/spool/news/03
/dev/da8       7.3T    6.6T     72G    99%    /news2/spool/news/04
/dev/da9       7.3T    6.6T     76G    99%    /news2/spool/news/05
/dev/da10      7.3T    6.6T     71G    99%    /news2/spool/news/06
/dev/da11      5.5T      5T     49G    99%    /news2/spool/news/07
/dev/da12      5.5T      5T     54G    99%    /news2/spool/news/08
/dev/da13      7.3T    6.6T     73G    99%    /news2/spool/news/09
/dev/da14      7.3T    6.6T     77G    99%    /news2/spool/news/10
/dev/da15      7.3T    6.6T     77G    99%    /news2/spool/news/11
/dev/da16      7.3T    6.6T     73G    99%    /news2/spool/news/12
/dev/da17      7.3T    6.6T     80G    99%    /news2/spool/news/13
/dev/da18      7.3T    6.6T     69G    99%    /news2/spool/news/14
/dev/da19      7.3T    6.6T     72G    99%    /news2/spool/news/15
/dev/da20      7.3T    6.6T     69G    99%    /news2/spool/news/16
/dev/da21      7.3T    6.6T     72G    99%    /news2/spool/news/17
/dev/da22      7.3T    6.6T     75G    99%    /news2/spool/news/18
/dev/da23      7.3T    6.6T     72G    99%    /news2/spool/news/19
/dev/da24      7.3T    6.6T     77G    99%    /news2/spool/news/20
/dev/da25      7.3T    6.6T     69G    99%    /news2/spool/news/21
/dev/da26      7.3T    6.6T     75G    99%    /news2/spool/news/22
/dev/da5       221G     36G    167G    18%    /news1
/dev/md0        40G     15G     20G    43%    /news3
| Incoming Feed (+ Top1000 #) | Accepted | %Acc | %Tot | Art/sec | Volume | %Vol | KB/art | Check | Ihave | Spam | TooOld | Rejs | Errs | ||
|---|---|---|---|---|---|---|---|---|---|---|---|---|---|---|---|
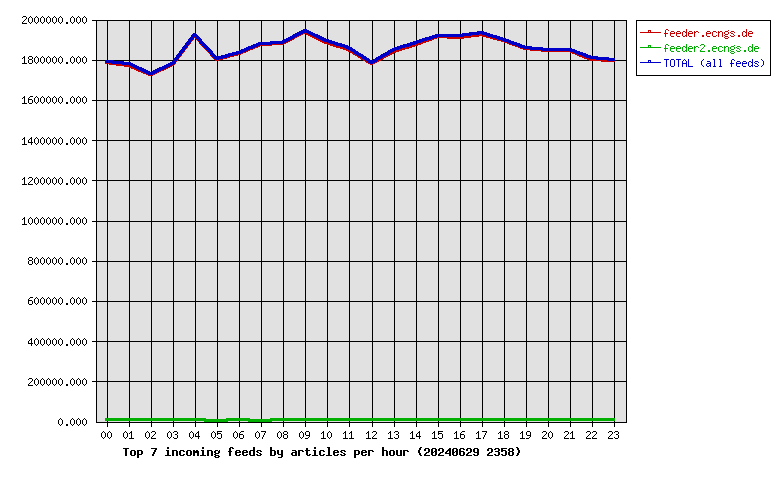
| 1 | feeder.ecngs.de | 44268017 | 88.15 | 99.64 | 512.36 | 29.68TB | 99.99 | 719.84 | 47410331 | 0 | 0 | 0 | 2808361 | 0 | |
| 2 | feeder2.ecngs.de | 162131 | 75.25 | 0.36 | 1.88 | 1.78GB | 0.01 | 11.54 | 214115 | 0 | 0 | 0 | 1350 | 0 | |
| Total | 44430148 | 0.00 | 100.00 | 514.24 | 29.68TB | 100.00 | 717.25 | 47624446 | 0 | 0 | 0 | 2809711 | 0 | ||
 |
| Incoming Feed (+ Top1000 #) | Volume | %Vol | Kbps | Accepted | %Acc | %Tot | KB/art | Check | Ihave | Spam | TooOld | Rejs | Errs | ||
|---|---|---|---|---|---|---|---|---|---|---|---|---|---|---|---|
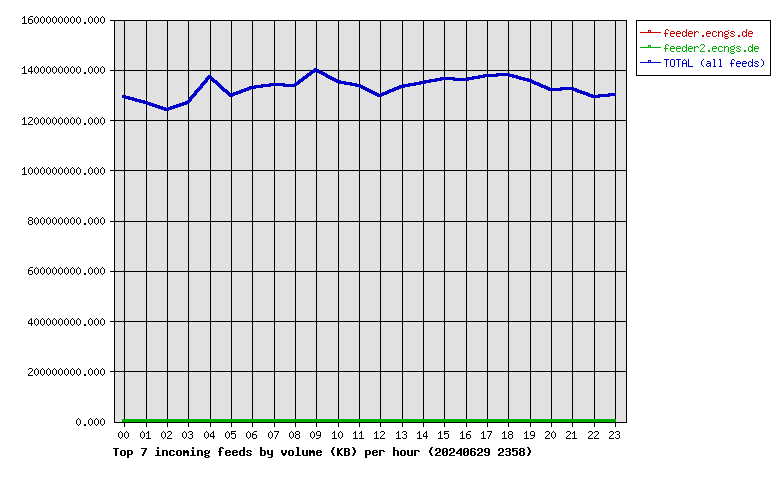
| 1 | feeder.ecngs.de | 29.68TB | 99.99 | 2950531.08 | 44268017 | 88.15 | 99.64 | 719.84 | 47410331 | 0 | 0 | 0 | 2808361 | 0 | |
| 2 | feeder2.ecngs.de | 1.78GB | 0.01 | 173.84 | 162131 | 75.25 | 0.36 | 11.54 | 214115 | 0 | 0 | 0 | 1350 | 0 | |
| Total | 29.68TB | 100.00 | 2950704.93 | 44430148 | 0.00 | 100.00 | 717.25 | 47624446 | 0 | 0 | 0 | 2809711 | 0 | ||
 |
| Incoming Feed (+ Top1000 #) | Rej. Vol. | %Vol | Kbps | Accepted | %Acc | %Tot | KB/art | Check | Ihave | Spam | TooOld | Rejs | Errs | ||
|---|---|---|---|---|---|---|---|---|---|---|---|---|---|---|---|
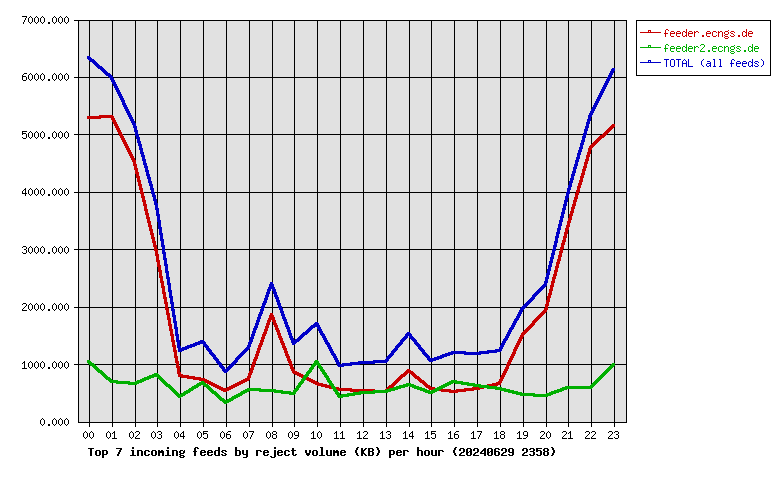
| 1 | feeder.ecngs.de | 44.62MB | 75.73 | 4.23 | 44268017 | 88.15 | 99.64 | 719.84 | 47410331 | 0 | 0 | 0 | 2808361 | 0 | |
| 2 | feeder2.ecngs.de | 14.30MB | 24.27 | 1.36 | 162131 | 75.25 | 0.36 | 11.54 | 214115 | 0 | 0 | 0 | 1350 | 0 | |
| Total | 58.92MB | 100.00 | 5.59 | 44430148 | 0.00 | 100.00 | 717.25 | 47624446 | 0 | 0 | 0 | 2809711 | 0 | ||
 |
| Hour | Accepted | %Acc | Volume | %Vol | Check | Ihave | Spam | Rejs | Errs |
|---|---|---|---|---|---|---|---|---|---|
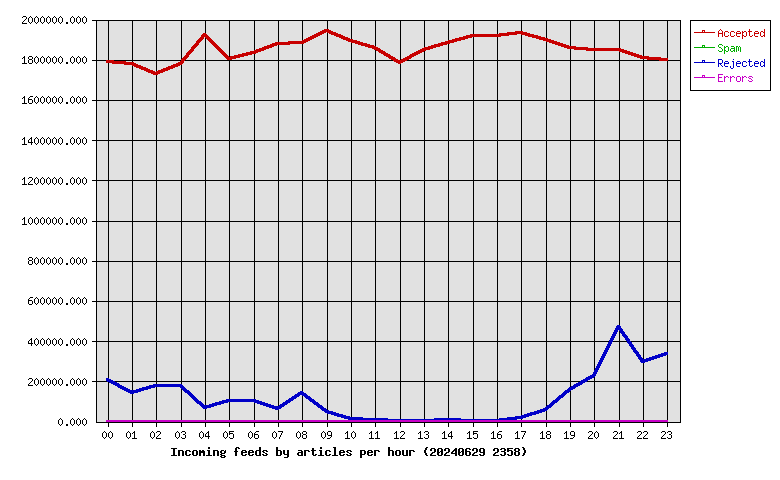
| 00 | 1789779 | 4.03 | 1.20TB | 4.05 | 2008930 | 0 | 0 | 206835 | 0 |
| 01 | 1776591 | 4.00 | 1.18TB | 3.98 | 1934556 | 0 | 0 | 141653 | 0 |
| 02 | 1730177 | 3.89 | 1.16TB | 3.90 | 1919604 | 0 | 0 | 176741 | 0 |
| 03 | 1778012 | 4.00 | 1.18TB | 3.98 | 1963359 | 0 | 0 | 174624 | 0 |
| 04 | 1924660 | 4.33 | 1.28TB | 4.31 | 2000127 | 0 | 0 | 66115 | 0 |
| 05 | 1804987 | 4.06 | 1.21TB | 4.06 | 2006561 | 0 | 0 | 104311 | 0 |
| 06 | 1832500 | 4.12 | 1.24TB | 4.17 | 1941398 | 0 | 0 | 100525 | 0 |
| 07 | 1879315 | 4.23 | 1.25TB | 4.20 | 1950591 | 0 | 0 | 64197 | 0 |
| 08 | 1885559 | 4.24 | 1.25TB | 4.20 | 2033851 | 0 | 0 | 139730 | 0 |
| 09 | 1942435 | 4.37 | 1.30TB | 4.40 | 1995608 | 0 | 0 | 45450 | 0 |
| 10 | 1893124 | 4.26 | 1.26TB | 4.24 | 1920021 | 0 | 0 | 10831 | 0 |
| 11 | 1856184 | 4.18 | 1.24TB | 4.19 | 1875466 | 0 | 0 | 6743 | 0 |
| 12 | 1784825 | 4.02 | 1.21TB | 4.06 | 1795702 | 0 | 0 | 98 | 0 |
| 13 | 1846232 | 4.16 | 1.24TB | 4.18 | 1859631 | 0 | 0 | 105 | 0 |
| 14 | 1880631 | 4.23 | 1.25TB | 4.22 | 1901081 | 0 | 0 | 7932 | 0 |
| 15 | 1919365 | 4.32 | 1.27TB | 4.28 | 1933115 | 0 | 0 | 1481 | 0 |
| 16 | 1916437 | 4.31 | 1.27TB | 4.27 | 1926245 | 0 | 0 | 203 | 0 |
| 17 | 1931139 | 4.35 | 1.28TB | 4.32 | 1960240 | 0 | 0 | 17653 | 0 |
| 18 | 1899614 | 4.28 | 1.28TB | 4.33 | 1966370 | 0 | 0 | 55516 | 0 |
| 19 | 1857135 | 4.18 | 1.26TB | 4.25 | 2053871 | 0 | 0 | 159169 | 0 |
| 20 | 1847298 | 4.16 | 1.23TB | 4.14 | 2087160 | 0 | 0 | 228718 | 0 |
| 21 | 1847960 | 4.16 | 1.23TB | 4.16 | 2328432 | 0 | 0 | 469889 | 0 |
| 22 | 1807167 | 4.07 | 1.20TB | 4.06 | 2116019 | 0 | 0 | 296560 | 0 |
| 23 | 1799022 | 4.05 | 1.21TB | 4.08 | 2146508 | 0 | 0 | 334632 | 0 |
| Total | 44430148 | 100.00 | 29.68TB | 100.00 | 47624446 | 0 | 0 | 2809711 | 0 |
 |
| Outgoing Feed (+ Top1000 #) | Accepted | %Acc | %Tot | Art/sec | Volume | %Vol | KB/art | Dups | Rejs | % Ratio (Out/In) | ||
|---|---|---|---|---|---|---|---|---|---|---|---|---|
| 1 | 217.73.144.40 | 0 | 0.00 | 0.00 | 0.00 | 0.00KB | 0.00 | 0.00 | 44197204 | 0 | … | |
| Total | 0 | 0.00 | 0.00 | 0.00 | 0.00KB | 0.00 | 0.00 | 44197204 | 0 | |||
 |
| Outgoing Feed (+ Top1000 #) | Volume | %Vol | Kbps | Accepted | %Acc | %Tot | KB/art | Dups | Rejs | % Ratio (Out/In) | ||
|---|---|---|---|---|---|---|---|---|---|---|---|---|
| 1 | 217.73.144.40 | 0.00KB | 0.00 | 0.00 | 0 | 0.00 | 0.00 | 0.00 | 44197204 | 0 | … | |
| Total | 0.00KB | 0.00 | 0.00 | 0 | 0.00 | 0.00 | 0.00 | 44197204 | 0 | |||
 |
| Outgoing Feed (+ Top1000 #) | Rej. Vol. | %Vol | Kbps | Accepted | %Acc | %Tot | KB/art | Dups | Rejs | % Ratio (Out/In) | ||
|---|---|---|---|---|---|---|---|---|---|---|---|---|
| 1 | 217.73.144.40 | 0.00KB | 0.00 | 0.00 | 0 | 0.00 | 0.00 | 0.00 | 44197204 | 0 | … | |
| Total | 0.00KB | 0.00 | 0.00 | 0 | 0.00 | 0.00 | 0.00 | 44197204 | 0 | |||
 |
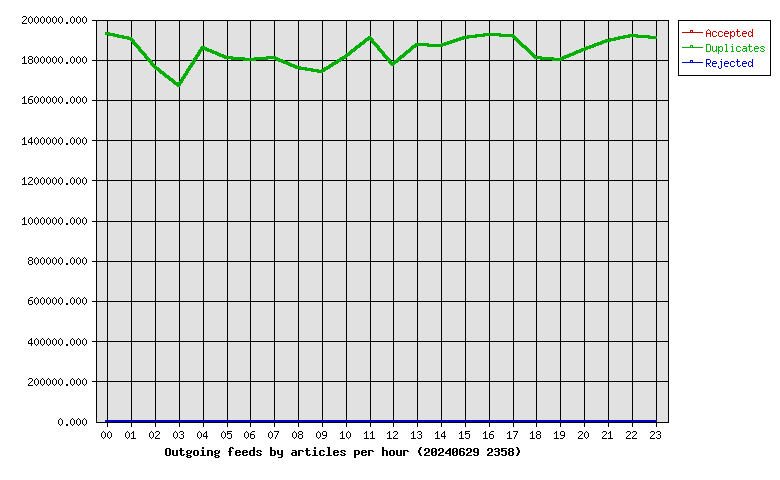
| Hour | Accepted | %Acc | Volume | %Vol | dups | Rejs |
|---|---|---|---|---|---|---|
| 00 | 0 | 0.00 | 0.00KB | 0.00 | 1926964 | 0 |
| 01 | 0 | 0.00 | 0.00KB | 0.00 | 1905281 | 0 |
| 02 | 0 | 0.00 | 0.00KB | 0.00 | 1762646 | 0 |
| 03 | 0 | 0.00 | 0.00KB | 0.00 | 1667167 | 0 |
| 04 | 0 | 0.00 | 0.00KB | 0.00 | 1858745 | 0 |
| 05 | 0 | 0.00 | 0.00KB | 0.00 | 1808394 | 0 |
| 06 | 0 | 0.00 | 0.00KB | 0.00 | 1799636 | 0 |
| 07 | 0 | 0.00 | 0.00KB | 0.00 | 1808983 | 0 |
| 08 | 0 | 0.00 | 0.00KB | 0.00 | 1758233 | 0 |
| 09 | 0 | 0.00 | 0.00KB | 0.00 | 1738087 | 0 |
| 10 | 0 | 0.00 | 0.00KB | 0.00 | 1815249 | 0 |
| 11 | 0 | 0.00 | 0.00KB | 0.00 | 1908983 | 0 |
| 12 | 0 | 0.00 | 0.00KB | 0.00 | 1772033 | 0 |
| 13 | 0 | 0.00 | 0.00KB | 0.00 | 1871541 | 0 |
| 14 | 0 | 0.00 | 0.00KB | 0.00 | 1869089 | 0 |
| 15 | 0 | 0.00 | 0.00KB | 0.00 | 1905984 | 0 |
| 16 | 0 | 0.00 | 0.00KB | 0.00 | 1924449 | 0 |
| 17 | 0 | 0.00 | 0.00KB | 0.00 | 1919954 | 0 |
| 18 | 0 | 0.00 | 0.00KB | 0.00 | 1808958 | 0 |
| 19 | 0 | 0.00 | 0.00KB | 0.00 | 1796499 | 0 |
| 20 | 0 | 0.00 | 0.00KB | 0.00 | 1848474 | 0 |
| 21 | 0 | 0.00 | 0.00KB | 0.00 | 1893617 | 0 |
| 22 | 0 | 0.00 | 0.00KB | 0.00 | 1919047 | 0 |
| 23 | 0 | 0.00 | 0.00KB | 0.00 | 1909191 | 0 |
| Total | 0 | 0.00 | 0.00KB | 0.00 | 44197204 | 0 |
 |
| >= 20% Full | >= 35% Full | >= 50% Full | >= 65% Full | >= 80% Full | >= 95% Full |
| Outgoing Feed | Batch Seq | Batch Num | Batch Max | %Full | Av. Pending |
|---|---|---|---|---|---|
| nbr.elbracht.net-o | 964736-964817 | 81 | 500 | 16 | 0.0 |
| text-spool-out | 0-0 | 0 | 500 | 0 | 0.0 |
| 1st Time | Last Time | # Msgs | Message |
|---|---|---|---|
| 22:06:51 | 1 | DNS Fwd/Rev mismatch: visit.keznews.com/194.165.16.73 | |
| 23:43:26 | 1 | DNS Fwd/Rev mismatch: lookup of centos7134235.aspadmin.net failed |