| |
DIABLO statistics for newsfeed.yoursite.com on Fri 28 Jun 2024 |
Generated on 20240628 2358 by feeder-stats v4.006. Copyright © 2002 The Diablo Project.
Diablo running processes:  90    Dnewslink running processes:  1


12:00AM  up 131 days,  7:19, 0 users, load averages: 10.39, 10.71, 10.77

Filesystem     Size    Used   Avail Capacity  Mounted on
/dev/da0s1g     94G    2.0G     84G     2%    /news
/dev/da1       7.3T    6.6T     70G    99%    /news2/spool/news/00
/dev/da2       7.3T    6.6T     71G    99%    /news2/spool/news/01
/dev/da3       3.7T    3.3T     62G    98%    /news2/spool/news/02
/dev/da4       5.5T      5T     58G    99%    /news2/spool/news/03
/dev/da8       7.3T    6.6T     67G    99%    /news2/spool/news/04
/dev/da9       7.3T    6.6T     70G    99%    /news2/spool/news/05
/dev/da10      7.3T    6.6T     66G    99%    /news2/spool/news/06
/dev/da11      5.5T      5T     74G    99%    /news2/spool/news/07
/dev/da12      5.5T      5T     53G    99%    /news2/spool/news/08
/dev/da13      7.3T    6.6T     65G    99%    /news2/spool/news/09
/dev/da14      7.3T    6.6T     72G    99%    /news2/spool/news/10
/dev/da15      7.3T    6.6T     72G    99%    /news2/spool/news/11
/dev/da16      7.3T    6.6T     67G    99%    /news2/spool/news/12
/dev/da17      7.3T    6.6T     77G    99%    /news2/spool/news/13
/dev/da18      7.3T    6.6T     62G    99%    /news2/spool/news/14
/dev/da19      7.3T    6.6T     67G    99%    /news2/spool/news/15
/dev/da20      7.3T    6.6T     67G    99%    /news2/spool/news/16
/dev/da21      7.3T    6.6T     65G    99%    /news2/spool/news/17
/dev/da22      7.3T    6.6T     70G    99%    /news2/spool/news/18
/dev/da23      7.3T    6.6T     68G    99%    /news2/spool/news/19
/dev/da24      7.3T    6.6T     75G    99%    /news2/spool/news/20
/dev/da25      7.3T    6.6T     66G    99%    /news2/spool/news/21
/dev/da26      7.3T    6.6T     68G    99%    /news2/spool/news/22
/dev/da5       221G     36G    167G    18%    /news1
/dev/md0        40G     15G     20G    43%    /news3
| Incoming Feed (+ Top1000 #) | Accepted | %Acc | %Tot | Art/sec | Volume | %Vol | KB/art | Check | Ihave | Spam | TooOld | Rejs | Errs | ||
|---|---|---|---|---|---|---|---|---|---|---|---|---|---|---|---|
| 1 | feeder.ecngs.de | 44734598 | 95.31 | 99.65 | 517.76 | 30.13TB | 99.99 | 723.22 | 45965524 | 0 | 0 | 0 | 968999 | 0 | |
| 2 | feeder2.ecngs.de | 158379 | 76.97 | 0.35 | 1.84 | 1.62GB | 0.01 | 10.74 | 204636 | 0 | 0 | 0 | 1134 | 0 | |
| Total | 44892977 | 0.00 | 100.00 | 519.60 | 30.13TB | 100.00 | 720.71 | 46170160 | 0 | 0 | 0 | 970133 | 0 | ||
 |
| Incoming Feed (+ Top1000 #) | Volume | %Vol | Kbps | Accepted | %Acc | %Tot | KB/art | Check | Ihave | Spam | TooOld | Rejs | Errs | ||
|---|---|---|---|---|---|---|---|---|---|---|---|---|---|---|---|
| 1 | feeder.ecngs.de | 30.13TB | 99.99 | 2995661.71 | 44734598 | 95.31 | 99.65 | 723.22 | 45965524 | 0 | 0 | 0 | 968999 | 0 | |
| 2 | feeder2.ecngs.de | 1.62GB | 0.01 | 157.96 | 158379 | 76.97 | 0.35 | 10.74 | 204636 | 0 | 0 | 0 | 1134 | 0 | |
| Total | 30.13TB | 100.00 | 2995819.67 | 44892977 | 0.00 | 100.00 | 720.71 | 46170160 | 0 | 0 | 0 | 970133 | 0 | ||
 |
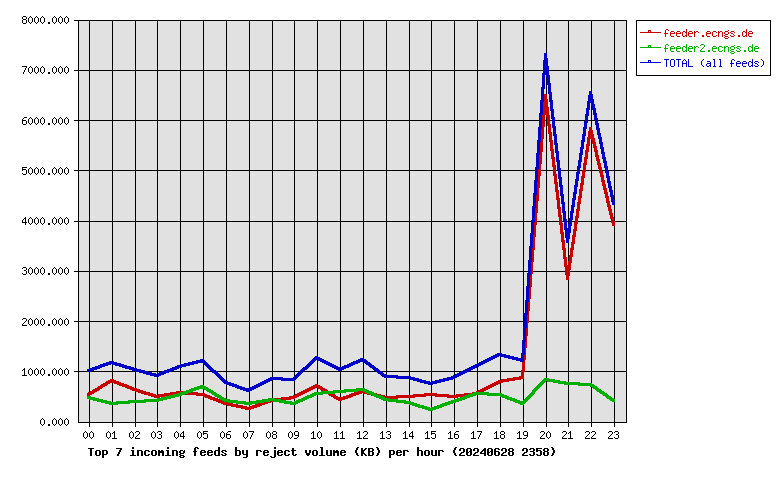
| Incoming Feed (+ Top1000 #) | Rej. Vol. | %Vol | Kbps | Accepted | %Acc | %Tot | KB/art | Check | Ihave | Spam | TooOld | Rejs | Errs | ||
|---|---|---|---|---|---|---|---|---|---|---|---|---|---|---|---|
| 1 | feeder.ecngs.de | 29.26MB | 71.95 | 2.77 | 44734598 | 95.31 | 99.65 | 723.22 | 45965524 | 0 | 0 | 0 | 968999 | 0 | |
| 2 | feeder2.ecngs.de | 11.41MB | 28.05 | 1.09 | 158379 | 76.97 | 0.35 | 10.74 | 204636 | 0 | 0 | 0 | 1134 | 0 | |
| Total | 40.67MB | 100.00 | 3.86 | 44892977 | 0.00 | 100.00 | 720.71 | 46170160 | 0 | 0 | 0 | 970133 | 0 | ||
 |
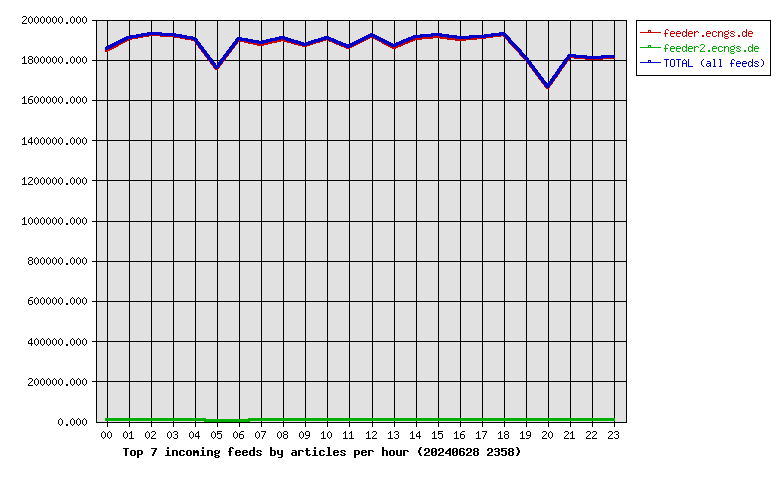
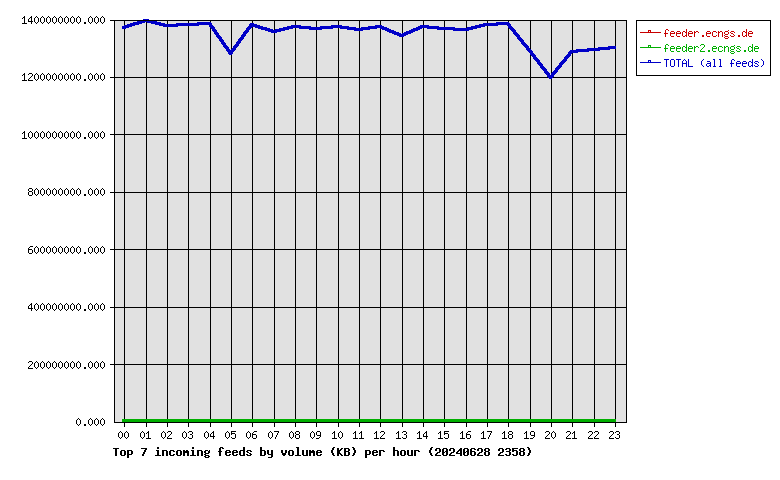
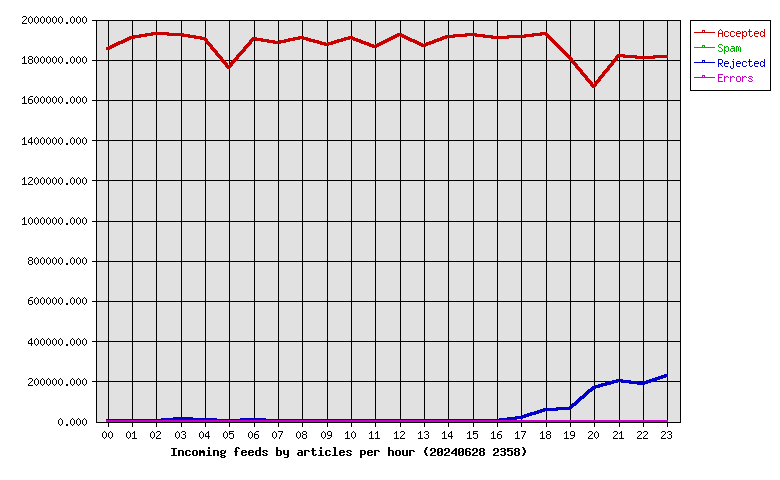
| Hour | Accepted | %Acc | Volume | %Vol | Check | Ihave | Spam | Rejs | Errs |
|---|---|---|---|---|---|---|---|---|---|
| 00 | 1850996 | 4.12 | 1.28TB | 4.24 | 1862463 | 0 | 0 | 647 | 0 |
| 01 | 1908767 | 4.25 | 1.30TB | 4.31 | 1922923 | 0 | 0 | 2875 | 0 |
| 02 | 1927880 | 4.29 | 1.28TB | 4.25 | 1940722 | 0 | 0 | 4569 | 0 |
| 03 | 1920744 | 4.28 | 1.29TB | 4.27 | 1941949 | 0 | 0 | 13239 | 0 |
| 04 | 1900618 | 4.23 | 1.29TB | 4.28 | 1918281 | 0 | 0 | 9578 | 0 |
| 05 | 1758064 | 3.92 | 1.19TB | 3.96 | 1826672 | 0 | 0 | 4730 | 0 |
| 06 | 1901738 | 4.24 | 1.29TB | 4.27 | 1915404 | 0 | 0 | 6247 | 0 |
| 07 | 1881892 | 4.19 | 1.26TB | 4.20 | 1893125 | 0 | 0 | 1466 | 0 |
| 08 | 1909028 | 4.25 | 1.28TB | 4.25 | 1922282 | 0 | 0 | 90 | 0 |
| 09 | 1873113 | 4.17 | 1.27TB | 4.23 | 1884579 | 0 | 0 | 895 | 0 |
| 10 | 1908179 | 4.25 | 1.28TB | 4.25 | 1919765 | 0 | 0 | 132 | 0 |
| 11 | 1861628 | 4.15 | 1.27TB | 4.22 | 1870454 | 0 | 0 | 347 | 0 |
| 12 | 1924042 | 4.29 | 1.28TB | 4.25 | 1937859 | 0 | 0 | 1490 | 0 |
| 13 | 1867440 | 4.16 | 1.25TB | 4.15 | 1878890 | 0 | 0 | 87 | 0 |
| 14 | 1910661 | 4.26 | 1.28TB | 4.24 | 1923203 | 0 | 0 | 430 | 0 |
| 15 | 1920759 | 4.28 | 1.27TB | 4.22 | 1930360 | 0 | 0 | 88 | 0 |
| 16 | 1907113 | 4.25 | 1.27TB | 4.21 | 1919471 | 0 | 0 | 887 | 0 |
| 17 | 1915184 | 4.27 | 1.29TB | 4.27 | 1944207 | 0 | 0 | 16187 | 0 |
| 18 | 1929797 | 4.30 | 1.29TB | 4.28 | 1997707 | 0 | 0 | 59632 | 0 |
| 19 | 1808680 | 4.03 | 1.20TB | 3.98 | 1881257 | 0 | 0 | 62017 | 0 |
| 20 | 1663988 | 3.71 | 1.11TB | 3.69 | 1844319 | 0 | 0 | 168845 | 0 |
| 21 | 1817770 | 4.05 | 1.20TB | 3.98 | 2029312 | 0 | 0 | 199610 | 0 |
| 22 | 1810377 | 4.03 | 1.21TB | 4.00 | 2010758 | 0 | 0 | 187676 | 0 |
| 23 | 1814519 | 4.04 | 1.21TB | 4.02 | 2054198 | 0 | 0 | 228369 | 0 |
| Total | 44892977 | 100.00 | 30.13TB | 100.00 | 46170160 | 0 | 0 | 970133 | 0 |
 |
| Outgoing Feed (+ Top1000 #) | Accepted | %Acc | %Tot | Art/sec | Volume | %Vol | KB/art | Dups | Rejs | % Ratio (Out/In) | ||
|---|---|---|---|---|---|---|---|---|---|---|---|---|
| 1 | 217.73.144.40 | 0 | 0.00 | 0.00 | 0.00 | 0.00KB | 0.00 | 0.00 | 45347624 | 0 | … | |
| Total | 0 | 0.00 | 0.00 | 0.00 | 0.00KB | 0.00 | 0.00 | 45347624 | 0 | |||
 |
| Outgoing Feed (+ Top1000 #) | Volume | %Vol | Kbps | Accepted | %Acc | %Tot | KB/art | Dups | Rejs | % Ratio (Out/In) | ||
|---|---|---|---|---|---|---|---|---|---|---|---|---|
| 1 | 217.73.144.40 | 0.00KB | 0.00 | 0.00 | 0 | 0.00 | 0.00 | 0.00 | 45347624 | 0 | … | |
| Total | 0.00KB | 0.00 | 0.00 | 0 | 0.00 | 0.00 | 0.00 | 45347624 | 0 | |||
 |
| Outgoing Feed (+ Top1000 #) | Rej. Vol. | %Vol | Kbps | Accepted | %Acc | %Tot | KB/art | Dups | Rejs | % Ratio (Out/In) | ||
|---|---|---|---|---|---|---|---|---|---|---|---|---|
| 1 | 217.73.144.40 | 0.00KB | 0.00 | 0.00 | 0 | 0.00 | 0.00 | 0.00 | 45347624 | 0 | … | |
| Total | 0.00KB | 0.00 | 0.00 | 0 | 0.00 | 0.00 | 0.00 | 45347624 | 0 | |||
 |
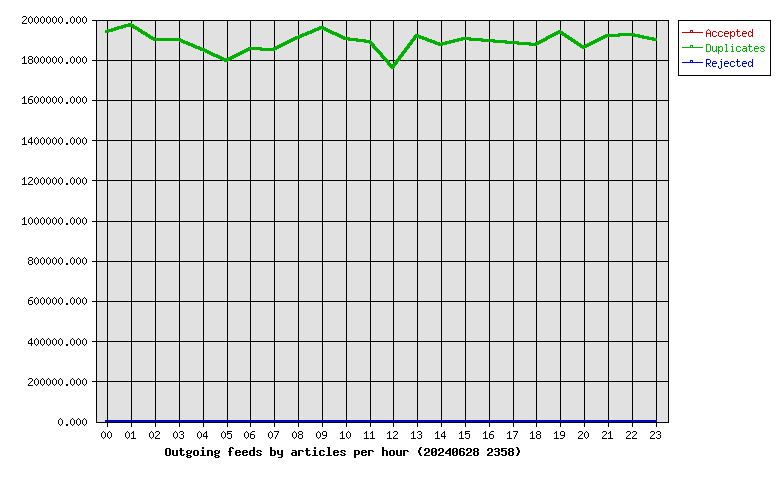
| Hour | Accepted | %Acc | Volume | %Vol | dups | Rejs |
|---|---|---|---|---|---|---|
| 00 | 0 | 0.00 | 0.00KB | 0.00 | 1939330 | 0 |
| 01 | 0 | 0.00 | 0.00KB | 0.00 | 1973133 | 0 |
| 02 | 0 | 0.00 | 0.00KB | 0.00 | 1900329 | 0 |
| 03 | 0 | 0.00 | 0.00KB | 0.00 | 1896172 | 0 |
| 04 | 0 | 0.00 | 0.00KB | 0.00 | 1850208 | 0 |
| 05 | 0 | 0.00 | 0.00KB | 0.00 | 1791057 | 0 |
| 06 | 0 | 0.00 | 0.00KB | 0.00 | 1853221 | 0 |
| 07 | 0 | 0.00 | 0.00KB | 0.00 | 1849088 | 0 |
| 08 | 0 | 0.00 | 0.00KB | 0.00 | 1910027 | 0 |
| 09 | 0 | 0.00 | 0.00KB | 0.00 | 1958822 | 0 |
| 10 | 0 | 0.00 | 0.00KB | 0.00 | 1903303 | 0 |
| 11 | 0 | 0.00 | 0.00KB | 0.00 | 1889646 | 0 |
| 12 | 0 | 0.00 | 0.00KB | 0.00 | 1757802 | 0 |
| 13 | 0 | 0.00 | 0.00KB | 0.00 | 1915902 | 0 |
| 14 | 0 | 0.00 | 0.00KB | 0.00 | 1874110 | 0 |
| 15 | 0 | 0.00 | 0.00KB | 0.00 | 1903084 | 0 |
| 16 | 0 | 0.00 | 0.00KB | 0.00 | 1890680 | 0 |
| 17 | 0 | 0.00 | 0.00KB | 0.00 | 1883355 | 0 |
| 18 | 0 | 0.00 | 0.00KB | 0.00 | 1873089 | 0 |
| 19 | 0 | 0.00 | 0.00KB | 0.00 | 1938474 | 0 |
| 20 | 0 | 0.00 | 0.00KB | 0.00 | 1858837 | 0 |
| 21 | 0 | 0.00 | 0.00KB | 0.00 | 1919613 | 0 |
| 22 | 0 | 0.00 | 0.00KB | 0.00 | 1920939 | 0 |
| 23 | 0 | 0.00 | 0.00KB | 0.00 | 1897403 | 0 |
| Total | 0 | 0.00 | 0.00KB | 0.00 | 45347624 | 0 |
 |
| >= 20% Full | >= 35% Full | >= 50% Full | >= 65% Full | >= 80% Full | >= 95% Full |
| Outgoing Feed | Batch Seq | Batch Num | Batch Max | %Full | Av. Pending |
|---|---|---|---|---|---|
| nbr.elbracht.net-o | 964448-964529 | 81 | 500 | 16 | 0.0 |
| text-spool-out | 0-0 | 0 | 500 | 0 | 0.0 |
| 1st Time | Last Time | # Msgs | Message |
|---|---|---|---|
| 01:34:45 | 1 | DNS Fwd/Rev mismatch: internettl.org/104.152.52.204 | |
| 01:35:15 | 1 | DNS Fwd/Rev mismatch: internettl.org/104.152.52.124 |