| |
DIABLO statistics for newsfeed.yoursite.com on Thu 27 Jun 2024 |
Generated on 20240627 2358 by feeder-stats v4.006. Copyright © 2002 The Diablo Project.
Diablo running processes:  82    Dnewslink running processes:  0


11:59PM  up 130 days,  7:19, 0 users, load averages: 6.43, 6.57, 6.38

Filesystem     Size    Used   Avail Capacity  Mounted on
/dev/da0s1g     94G    2.1G     84G     2%    /news
/dev/da1       7.3T    6.7T     43G    99%    /news2/spool/news/00
/dev/da2       7.3T    6.7T     46G    99%    /news2/spool/news/01
/dev/da3       3.7T    3.3T     42G    99%    /news2/spool/news/02
/dev/da4       5.5T      5T     78G    98%    /news2/spool/news/03
/dev/da8       7.3T    6.7T     41G    99%    /news2/spool/news/04
/dev/da9       7.3T    6.7T     44G    99%    /news2/spool/news/05
/dev/da10      7.3T    6.7T     41G    99%    /news2/spool/news/06
/dev/da11      5.5T      5T     81G    98%    /news2/spool/news/07
/dev/da12      5.5T      5T     73G    99%    /news2/spool/news/08
/dev/da13      7.3T    6.7T     39G    99%    /news2/spool/news/09
/dev/da14      7.3T    6.7T     43G    99%    /news2/spool/news/10
/dev/da15      7.3T    6.7T     44G    99%    /news2/spool/news/11
/dev/da16      7.3T    6.7T     42G    99%    /news2/spool/news/12
/dev/da17      7.3T    6.7T     48G    99%    /news2/spool/news/13
/dev/da18      7.3T    6.7T     38G    99%    /news2/spool/news/14
/dev/da19      7.3T    6.7T     42G    99%    /news2/spool/news/15
/dev/da20      7.3T    6.7T     42G    99%    /news2/spool/news/16
/dev/da21      7.3T    6.7T     38G    99%    /news2/spool/news/17
/dev/da22      7.3T    6.7T     43G    99%    /news2/spool/news/18
/dev/da23      7.3T    6.7T     41G    99%    /news2/spool/news/19
/dev/da24      7.3T    6.7T     48G    99%    /news2/spool/news/20
/dev/da25      7.3T    6.7T     42G    99%    /news2/spool/news/21
/dev/da26      7.3T    6.7T     42G    99%    /news2/spool/news/22
/dev/da5       221G     36G    167G    18%    /news1
/dev/md0        40G     15G     20G    43%    /news3
| Incoming Feed (+ Top1000 #) | Accepted | %Acc | %Tot | Art/sec | Volume | %Vol | KB/art | Check | Ihave | Spam | TooOld | Rejs | Errs | ||
|---|---|---|---|---|---|---|---|---|---|---|---|---|---|---|---|
| 1 | feeder.ecngs.de | 43841030 | 92.11 | 99.65 | 507.42 | 29.76TB | 99.99 | 728.79 | 45870880 | 0 | 0 | 0 | 1724171 | 0 | |
| 2 | feeder2.ecngs.de | 153192 | 75.75 | 0.35 | 1.78 | 1.55GB | 0.01 | 10.61 | 201100 | 0 | 0 | 0 | 1141 | 0 | |
| Total | 43994222 | 0.00 | 100.00 | 509.20 | 29.76TB | 100.00 | 726.29 | 46071980 | 0 | 0 | 0 | 1725312 | 0 | ||
 |
| Incoming Feed (+ Top1000 #) | Volume | %Vol | Kbps | Accepted | %Acc | %Tot | KB/art | Check | Ihave | Spam | TooOld | Rejs | Errs | ||
|---|---|---|---|---|---|---|---|---|---|---|---|---|---|---|---|
| 1 | feeder.ecngs.de | 29.76TB | 99.99 | 2958409.81 | 43841030 | 92.11 | 99.65 | 728.79 | 45870880 | 0 | 0 | 0 | 1724171 | 0 | |
| 2 | feeder2.ecngs.de | 1.55GB | 0.01 | 150.98 | 153192 | 75.75 | 0.35 | 10.61 | 201100 | 0 | 0 | 0 | 1141 | 0 | |
| Total | 29.76TB | 100.00 | 2958560.78 | 43994222 | 0.00 | 100.00 | 726.29 | 46071980 | 0 | 0 | 0 | 1725312 | 0 | ||
 |
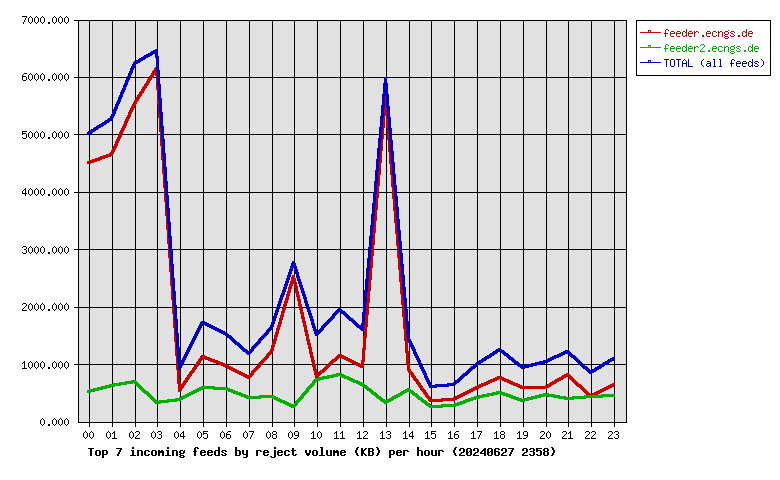
| Incoming Feed (+ Top1000 #) | Rej. Vol. | %Vol | Kbps | Accepted | %Acc | %Tot | KB/art | Check | Ihave | Spam | TooOld | Rejs | Errs | ||
|---|---|---|---|---|---|---|---|---|---|---|---|---|---|---|---|
| 1 | feeder.ecngs.de | 41.42MB | 78.94 | 3.93 | 43841030 | 92.11 | 99.65 | 728.79 | 45870880 | 0 | 0 | 0 | 1724171 | 0 | |
| 2 | feeder2.ecngs.de | 11.05MB | 21.06 | 1.05 | 153192 | 75.75 | 0.35 | 10.61 | 201100 | 0 | 0 | 0 | 1141 | 0 | |
| Total | 52.46MB | 100.00 | 4.98 | 43994222 | 0.00 | 100.00 | 726.29 | 46071980 | 0 | 0 | 0 | 1725312 | 0 | ||
 |
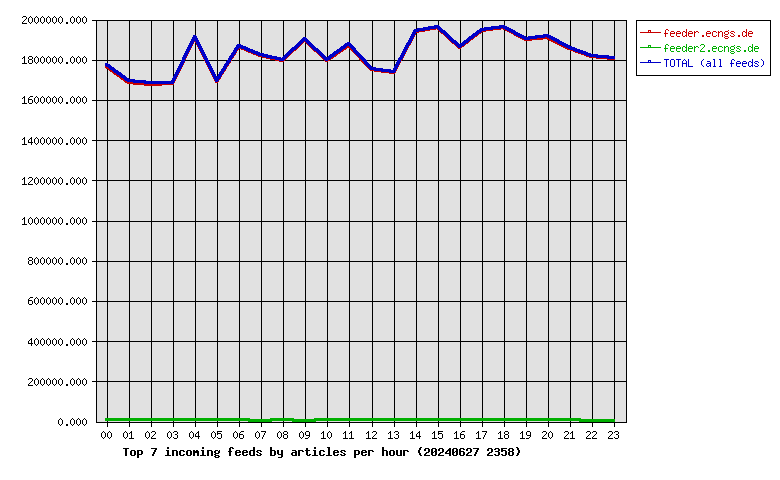
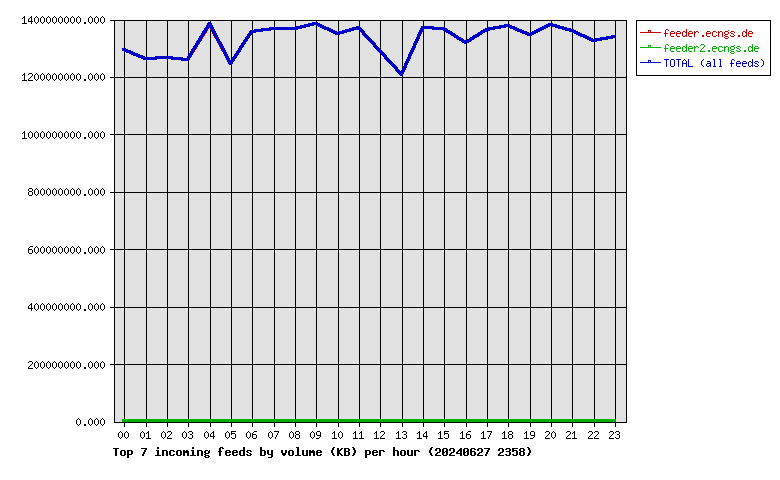
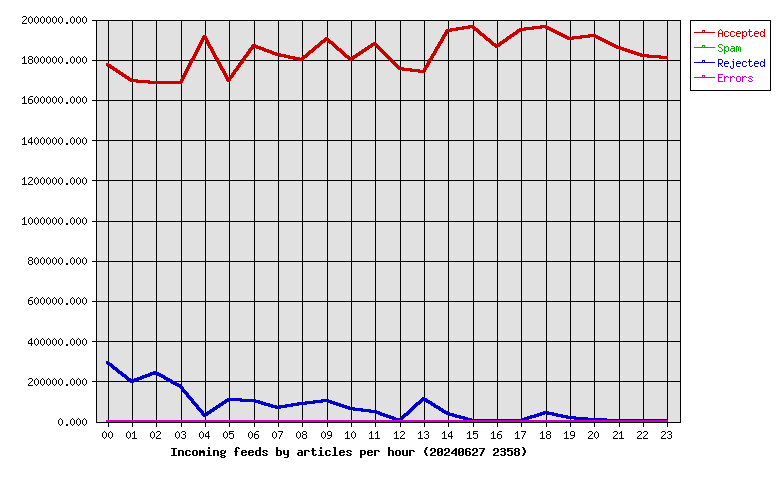
| Hour | Accepted | %Acc | Volume | %Vol | Check | Ihave | Spam | Rejs | Errs |
|---|---|---|---|---|---|---|---|---|---|
| 00 | 1771173 | 4.03 | 1.20TB | 4.05 | 2072975 | 0 | 0 | 289658 | 0 |
| 01 | 1691961 | 3.85 | 1.17TB | 3.95 | 1899998 | 0 | 0 | 195383 | 0 |
| 02 | 1683408 | 3.83 | 1.18TB | 3.96 | 1941195 | 0 | 0 | 242369 | 0 |
| 03 | 1684528 | 3.83 | 1.17TB | 3.94 | 1869262 | 0 | 0 | 174069 | 0 |
| 04 | 1914066 | 4.35 | 1.29TB | 4.33 | 1949768 | 0 | 0 | 26802 | 0 |
| 05 | 1694191 | 3.85 | 1.16TB | 3.90 | 1913415 | 0 | 0 | 106534 | 0 |
| 06 | 1867071 | 4.24 | 1.26TB | 4.24 | 1976288 | 0 | 0 | 100844 | 0 |
| 07 | 1823645 | 4.15 | 1.27TB | 4.28 | 1896316 | 0 | 0 | 66201 | 0 |
| 08 | 1799081 | 4.09 | 1.27TB | 4.28 | 1897098 | 0 | 0 | 88860 | 0 |
| 09 | 1903760 | 4.33 | 1.29TB | 4.33 | 2013066 | 0 | 0 | 102347 | 0 |
| 10 | 1798166 | 4.09 | 1.26TB | 4.23 | 1869543 | 0 | 0 | 61014 | 0 |
| 11 | 1876401 | 4.27 | 1.28TB | 4.29 | 1937022 | 0 | 0 | 47148 | 0 |
| 12 | 1756043 | 3.99 | 1.20TB | 4.04 | 1773879 | 0 | 0 | 4597 | 0 |
| 13 | 1739097 | 3.95 | 1.12TB | 3.78 | 1862918 | 0 | 0 | 111162 | 0 |
| 14 | 1945121 | 4.42 | 1.28TB | 4.29 | 1994034 | 0 | 0 | 36362 | 0 |
| 15 | 1963962 | 4.46 | 1.27TB | 4.28 | 1976594 | 0 | 0 | 82 | 0 |
| 16 | 1863347 | 4.24 | 1.23TB | 4.12 | 1873162 | 0 | 0 | 61 | 0 |
| 17 | 1948022 | 4.43 | 1.27TB | 4.26 | 1959798 | 0 | 0 | 844 | 0 |
| 18 | 1964700 | 4.47 | 1.28TB | 4.31 | 2016945 | 0 | 0 | 43326 | 0 |
| 19 | 1902044 | 4.32 | 1.25TB | 4.22 | 1930434 | 0 | 0 | 19030 | 0 |
| 20 | 1915869 | 4.35 | 1.29TB | 4.32 | 1934245 | 0 | 0 | 7252 | 0 |
| 21 | 1857382 | 4.22 | 1.27TB | 4.25 | 1868060 | 0 | 0 | 1208 | 0 |
| 22 | 1820488 | 4.14 | 1.24TB | 4.15 | 1827490 | 0 | 0 | 76 | 0 |
| 23 | 1810696 | 4.12 | 1.25TB | 4.19 | 1818475 | 0 | 0 | 83 | 0 |
| Total | 43994222 | 100.00 | 29.76TB | 100.00 | 46071980 | 0 | 0 | 1725312 | 0 |
 |
| Outgoing Feed (+ Top1000 #) | Accepted | %Acc | %Tot | Art/sec | Volume | %Vol | KB/art | Dups | Rejs | % Ratio (Out/In) | ||
|---|---|---|---|---|---|---|---|---|---|---|---|---|
| 1 | 217.73.144.40 | 0 | 0.00 | 0.00 | 0.00 | 0.00KB | 0.00 | 0.00 | 42966257 | 0 | … | |
| Total | 0 | 0.00 | 0.00 | 0.00 | 0.00KB | 0.00 | 0.00 | 42966257 | 0 | |||
 |
| Outgoing Feed (+ Top1000 #) | Volume | %Vol | Kbps | Accepted | %Acc | %Tot | KB/art | Dups | Rejs | % Ratio (Out/In) | ||
|---|---|---|---|---|---|---|---|---|---|---|---|---|
| 1 | 217.73.144.40 | 0.00KB | 0.00 | 0.00 | 0 | 0.00 | 0.00 | 0.00 | 42966257 | 0 | … | |
| Total | 0.00KB | 0.00 | 0.00 | 0 | 0.00 | 0.00 | 0.00 | 42966257 | 0 | |||
 |
| Outgoing Feed (+ Top1000 #) | Rej. Vol. | %Vol | Kbps | Accepted | %Acc | %Tot | KB/art | Dups | Rejs | % Ratio (Out/In) | ||
|---|---|---|---|---|---|---|---|---|---|---|---|---|
| 1 | 217.73.144.40 | 0.00KB | 0.00 | 0.00 | 0 | 0.00 | 0.00 | 0.00 | 42966257 | 0 | … | |
| Total | 0.00KB | 0.00 | 0.00 | 0 | 0.00 | 0.00 | 0.00 | 42966257 | 0 | |||
 |
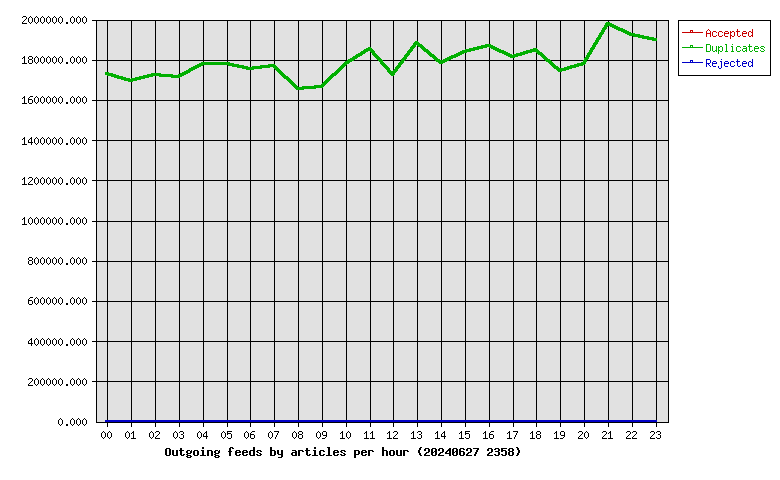
| Hour | Accepted | %Acc | Volume | %Vol | dups | Rejs |
|---|---|---|---|---|---|---|
| 00 | 0 | 0.00 | 0.00KB | 0.00 | 1726425 | 0 |
| 01 | 0 | 0.00 | 0.00KB | 0.00 | 1694193 | 0 |
| 02 | 0 | 0.00 | 0.00KB | 0.00 | 1724466 | 0 |
| 03 | 0 | 0.00 | 0.00KB | 0.00 | 1712231 | 0 |
| 04 | 0 | 0.00 | 0.00KB | 0.00 | 1777408 | 0 |
| 05 | 0 | 0.00 | 0.00KB | 0.00 | 1778188 | 0 |
| 06 | 0 | 0.00 | 0.00KB | 0.00 | 1751823 | 0 |
| 07 | 0 | 0.00 | 0.00KB | 0.00 | 1770647 | 0 |
| 08 | 0 | 0.00 | 0.00KB | 0.00 | 1655429 | 0 |
| 09 | 0 | 0.00 | 0.00KB | 0.00 | 1664167 | 0 |
| 10 | 0 | 0.00 | 0.00KB | 0.00 | 1779940 | 0 |
| 11 | 0 | 0.00 | 0.00KB | 0.00 | 1850820 | 0 |
| 12 | 0 | 0.00 | 0.00KB | 0.00 | 1725281 | 0 |
| 13 | 0 | 0.00 | 0.00KB | 0.00 | 1883537 | 0 |
| 14 | 0 | 0.00 | 0.00KB | 0.00 | 1783867 | 0 |
| 15 | 0 | 0.00 | 0.00KB | 0.00 | 1838348 | 0 |
| 16 | 0 | 0.00 | 0.00KB | 0.00 | 1870133 | 0 |
| 17 | 0 | 0.00 | 0.00KB | 0.00 | 1811400 | 0 |
| 18 | 0 | 0.00 | 0.00KB | 0.00 | 1847145 | 0 |
| 19 | 0 | 0.00 | 0.00KB | 0.00 | 1743769 | 0 |
| 20 | 0 | 0.00 | 0.00KB | 0.00 | 1777872 | 0 |
| 21 | 0 | 0.00 | 0.00KB | 0.00 | 1976536 | 0 |
| 22 | 0 | 0.00 | 0.00KB | 0.00 | 1922599 | 0 |
| 23 | 0 | 0.00 | 0.00KB | 0.00 | 1900033 | 0 |
| Total | 0 | 0.00 | 0.00KB | 0.00 | 42966257 | 0 |
 |
| >= 20% Full | >= 35% Full | >= 50% Full | >= 65% Full | >= 80% Full | >= 95% Full |
| Outgoing Feed | Batch Seq | Batch Num | Batch Max | %Full | Av. Pending |
|---|---|---|---|---|---|
| nbr.elbracht.net-o | 964159-964240 | 81 | 500 | 16 | 0.0 |
| text-spool-out | 0-0 | 0 | 500 | 0 | 0.0 |
| 1st Time | Last Time | # Msgs | Message |
|---|