| |
DIABLO statistics for newsfeed.yoursite.com on Wed 26 Jun 2024 |
Generated on 20240626 2358 by feeder-stats v4.006. Copyright © 2002 The Diablo Project.
Diablo running processes:  91    Dnewslink running processes:  1


12:00AM  up 129 days,  7:19, 0 users, load averages: 14.30, 11.84, 11.07

Filesystem     Size    Used   Avail Capacity  Mounted on
/dev/da0s1g     94G      2G     84G     2%    /news
/dev/da1       7.3T    6.6T     67G    99%    /news2/spool/news/00
/dev/da2       7.3T    6.6T     71G    99%    /news2/spool/news/01
/dev/da3       3.7T    3.3T     97G    97%    /news2/spool/news/02
/dev/da4       5.5T      5T     75G    99%    /news2/spool/news/03
/dev/da8       7.3T    6.6T     65G    99%    /news2/spool/news/04
/dev/da9       7.3T    6.6T     72G    99%    /news2/spool/news/05
/dev/da10      7.3T    6.6T     67G    99%    /news2/spool/news/06
/dev/da11      5.5T      5T     48G    99%    /news2/spool/news/07
/dev/da12      5.5T      5T     50G    99%    /news2/spool/news/08
/dev/da13      7.3T    6.6T     65G    99%    /news2/spool/news/09
/dev/da14      7.3T    6.6T     71G    99%    /news2/spool/news/10
/dev/da15      7.3T    6.6T     69G    99%    /news2/spool/news/11
/dev/da16      7.3T    6.6T     69G    99%    /news2/spool/news/12
/dev/da17      7.3T    6.6T     69G    99%    /news2/spool/news/13
/dev/da18      7.3T    6.6T     63G    99%    /news2/spool/news/14
/dev/da19      7.3T    6.6T     71G    99%    /news2/spool/news/15
/dev/da20      7.3T    6.6T     68G    99%    /news2/spool/news/16
/dev/da21      7.3T    6.6T     68G    99%    /news2/spool/news/17
/dev/da22      7.3T    6.6T     68G    99%    /news2/spool/news/18
/dev/da23      7.3T    6.6T     67G    99%    /news2/spool/news/19
/dev/da24      7.3T    6.6T     75G    99%    /news2/spool/news/20
/dev/da25      7.3T    6.6T     69G    99%    /news2/spool/news/21
/dev/da26      7.3T    6.6T     71G    99%    /news2/spool/news/22
/dev/da5       221G     36G    167G    18%    /news1
/dev/md0        40G     15G     20G    43%    /news3
| Incoming Feed (+ Top1000 #) | Accepted | %Acc | %Tot | Art/sec | Volume | %Vol | KB/art | Check | Ihave | Spam | TooOld | Rejs | Errs | ||
|---|---|---|---|---|---|---|---|---|---|---|---|---|---|---|---|
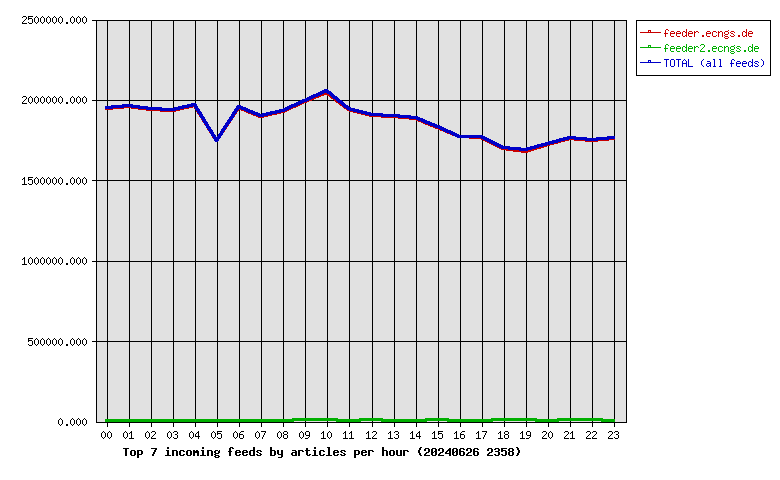
| 1 | feeder.ecngs.de | 44584397 | 86.03 | 99.69 | 516.02 | 29.85TB | 100.00 | 718.94 | 48328313 | 0 | 0 | 0 | 3497210 | 0 | |
| 2 | feeder2.ecngs.de | 136440 | 74.78 | 0.31 | 1.58 | 1.39GB | 0.00 | 10.70 | 181261 | 0 | 0 | 0 | 1187 | 0 | |
| Total | 44720837 | 0.00 | 100.00 | 517.61 | 29.85TB | 100.00 | 716.78 | 48509574 | 0 | 0 | 0 | 3498397 | 0 | ||
 |
| Incoming Feed (+ Top1000 #) | Volume | %Vol | Kbps | Accepted | %Acc | %Tot | KB/art | Check | Ihave | Spam | TooOld | Rejs | Errs | ||
|---|---|---|---|---|---|---|---|---|---|---|---|---|---|---|---|
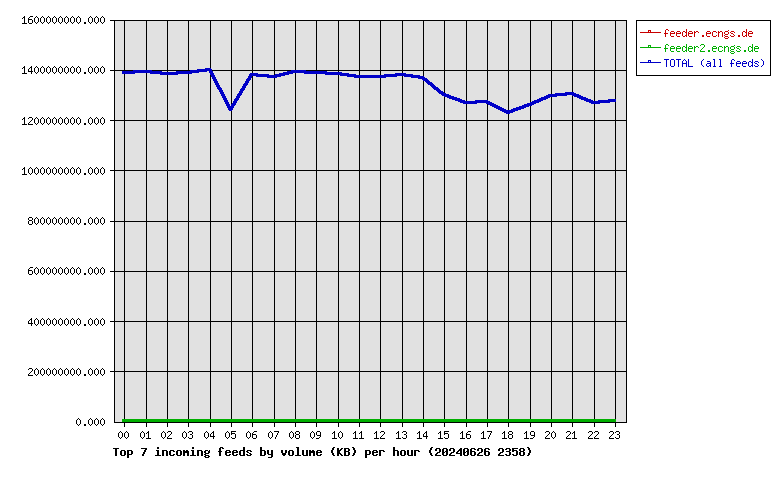
| 1 | feeder.ecngs.de | 29.85TB | 100.00 | 2967916.60 | 44584397 | 86.03 | 99.69 | 718.94 | 48328313 | 0 | 0 | 0 | 3497210 | 0 | |
| 2 | feeder2.ecngs.de | 1.39GB | 0.00 | 135.59 | 136440 | 74.78 | 0.31 | 10.70 | 181261 | 0 | 0 | 0 | 1187 | 0 | |
| Total | 29.85TB | 100.00 | 2968052.19 | 44720837 | 0.00 | 100.00 | 716.78 | 48509574 | 0 | 0 | 0 | 3498397 | 0 | ||
 |
| Incoming Feed (+ Top1000 #) | Rej. Vol. | %Vol | Kbps | Accepted | %Acc | %Tot | KB/art | Check | Ihave | Spam | TooOld | Rejs | Errs | ||
|---|---|---|---|---|---|---|---|---|---|---|---|---|---|---|---|
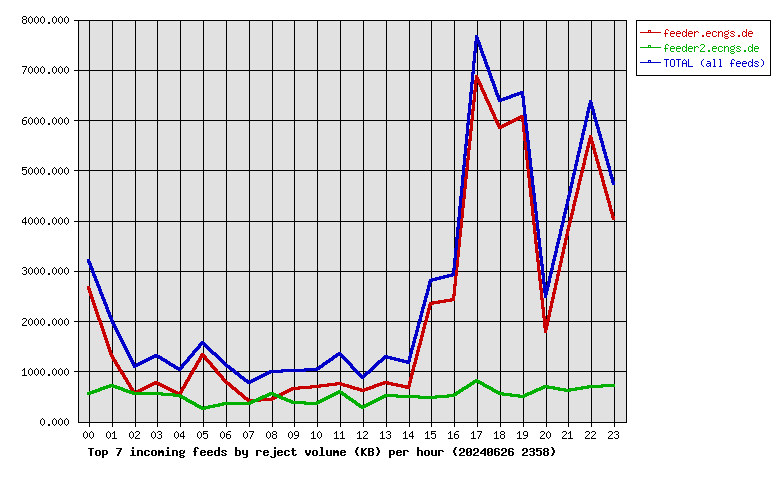
| 1 | feeder.ecngs.de | 50.36MB | 80.64 | 4.77 | 44584397 | 86.03 | 99.69 | 718.94 | 48328313 | 0 | 0 | 0 | 3497210 | 0 | |
| 2 | feeder2.ecngs.de | 12.09MB | 19.36 | 1.15 | 136440 | 74.78 | 0.31 | 10.70 | 181261 | 0 | 0 | 0 | 1187 | 0 | |
| Total | 62.45MB | 100.00 | 5.93 | 44720837 | 0.00 | 100.00 | 716.78 | 48509574 | 0 | 0 | 0 | 3498397 | 0 | ||
 |
| Hour | Accepted | %Acc | Volume | %Vol | Check | Ihave | Spam | Rejs | Errs |
|---|---|---|---|---|---|---|---|---|---|
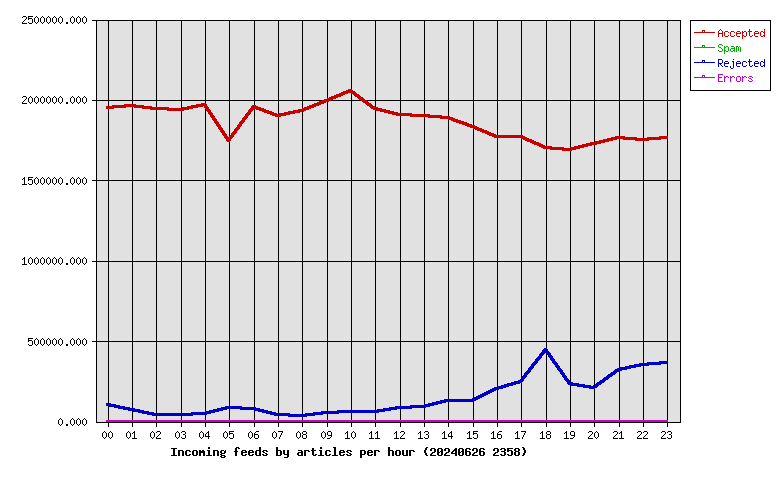
| 00 | 1950805 | 4.36 | 1.29TB | 4.33 | 2061787 | 0 | 0 | 101898 | 0 |
| 01 | 1958974 | 4.38 | 1.29TB | 4.34 | 2036017 | 0 | 0 | 69223 | 0 |
| 02 | 1943718 | 4.35 | 1.29TB | 4.32 | 1991946 | 0 | 0 | 41036 | 0 |
| 03 | 1935999 | 4.33 | 1.29TB | 4.33 | 1981768 | 0 | 0 | 38778 | 0 |
| 04 | 1965844 | 4.40 | 1.30TB | 4.37 | 2017587 | 0 | 0 | 44324 | 0 |
| 05 | 1745705 | 3.90 | 1.15TB | 3.87 | 1897594 | 0 | 0 | 81434 | 0 |
| 06 | 1957647 | 4.38 | 1.28TB | 4.30 | 2040139 | 0 | 0 | 75053 | 0 |
| 07 | 1897780 | 4.24 | 1.28TB | 4.27 | 1948805 | 0 | 0 | 43359 | 0 |
| 08 | 1928365 | 4.31 | 1.29TB | 4.33 | 1971066 | 0 | 0 | 35740 | 0 |
| 09 | 1991309 | 4.45 | 1.29TB | 4.33 | 2054754 | 0 | 0 | 52402 | 0 |
| 10 | 2052423 | 4.59 | 1.29TB | 4.32 | 2123674 | 0 | 0 | 57172 | 0 |
| 11 | 1943847 | 4.35 | 1.28TB | 4.28 | 2013304 | 0 | 0 | 61033 | 0 |
| 12 | 1904134 | 4.26 | 1.28TB | 4.28 | 1996888 | 0 | 0 | 81248 | 0 |
| 13 | 1899724 | 4.25 | 1.28TB | 4.30 | 2001915 | 0 | 0 | 93172 | 0 |
| 14 | 1886901 | 4.22 | 1.27TB | 4.26 | 2019841 | 0 | 0 | 126204 | 0 |
| 15 | 1832958 | 4.10 | 1.21TB | 4.06 | 1975641 | 0 | 0 | 129888 | 0 |
| 16 | 1772249 | 3.96 | 1.18TB | 3.95 | 1985156 | 0 | 0 | 203020 | 0 |
| 17 | 1767155 | 3.95 | 1.18TB | 3.96 | 2019835 | 0 | 0 | 243837 | 0 |
| 18 | 1702573 | 3.81 | 1.14TB | 3.83 | 2161114 | 0 | 0 | 447285 | 0 |
| 19 | 1685807 | 3.77 | 1.17TB | 3.93 | 1930767 | 0 | 0 | 232903 | 0 |
| 20 | 1727474 | 3.86 | 1.21TB | 4.05 | 1942922 | 0 | 0 | 205444 | 0 |
| 21 | 1760657 | 3.94 | 1.21TB | 4.06 | 2090093 | 0 | 0 | 317903 | 0 |
| 22 | 1748235 | 3.91 | 1.18TB | 3.95 | 2110431 | 0 | 0 | 350265 | 0 |
| 23 | 1760554 | 3.94 | 1.19TB | 3.98 | 2136530 | 0 | 0 | 365776 | 0 |
| Total | 44720837 | 100.00 | 29.85TB | 100.00 | 48509574 | 0 | 0 | 3498397 | 0 |
 |
| Outgoing Feed (+ Top1000 #) | Accepted | %Acc | %Tot | Art/sec | Volume | %Vol | KB/art | Dups | Rejs | % Ratio (Out/In) | ||
|---|---|---|---|---|---|---|---|---|---|---|---|---|
| 1 | 217.73.144.40 | 0 | 0.00 | 0.00 | 0.00 | 0.00KB | 0.00 | 0.00 | 46018975 | 0 | … | |
| Total | 0 | 0.00 | 0.00 | 0.00 | 0.00KB | 0.00 | 0.00 | 46018975 | 0 | |||
 |
| Outgoing Feed (+ Top1000 #) | Volume | %Vol | Kbps | Accepted | %Acc | %Tot | KB/art | Dups | Rejs | % Ratio (Out/In) | ||
|---|---|---|---|---|---|---|---|---|---|---|---|---|
| 1 | 217.73.144.40 | 0.00KB | 0.00 | 0.00 | 0 | 0.00 | 0.00 | 0.00 | 46018975 | 0 | … | |
| Total | 0.00KB | 0.00 | 0.00 | 0 | 0.00 | 0.00 | 0.00 | 46018975 | 0 | |||
 |
| Outgoing Feed (+ Top1000 #) | Rej. Vol. | %Vol | Kbps | Accepted | %Acc | %Tot | KB/art | Dups | Rejs | % Ratio (Out/In) | ||
|---|---|---|---|---|---|---|---|---|---|---|---|---|
| 1 | 217.73.144.40 | 0.00KB | 0.00 | 0.00 | 0 | 0.00 | 0.00 | 0.00 | 46018975 | 0 | … | |
| Total | 0.00KB | 0.00 | 0.00 | 0 | 0.00 | 0.00 | 0.00 | 46018975 | 0 | |||
 |
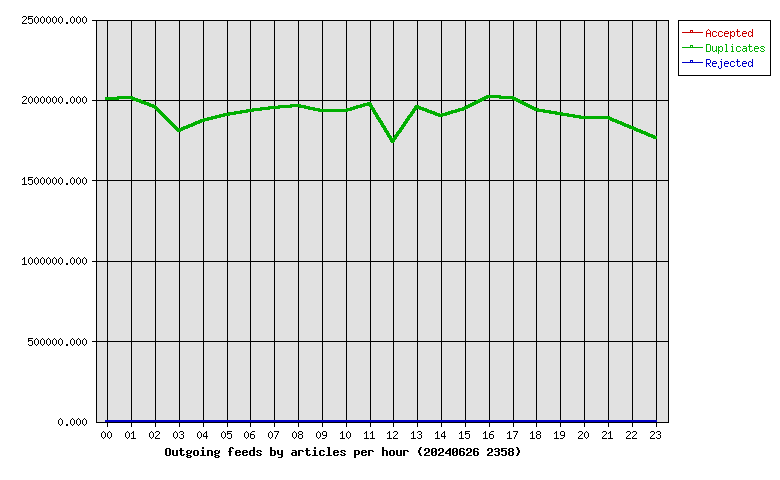
| Hour | Accepted | %Acc | Volume | %Vol | dups | Rejs |
|---|---|---|---|---|---|---|
| 00 | 0 | 0.00 | 0.00KB | 0.00 | 2007926 | 0 |
| 01 | 0 | 0.00 | 0.00KB | 0.00 | 2014672 | 0 |
| 02 | 0 | 0.00 | 0.00KB | 0.00 | 1958529 | 0 |
| 03 | 0 | 0.00 | 0.00KB | 0.00 | 1807952 | 0 |
| 04 | 0 | 0.00 | 0.00KB | 0.00 | 1868525 | 0 |
| 05 | 0 | 0.00 | 0.00KB | 0.00 | 1906770 | 0 |
| 06 | 0 | 0.00 | 0.00KB | 0.00 | 1930210 | 0 |
| 07 | 0 | 0.00 | 0.00KB | 0.00 | 1951345 | 0 |
| 08 | 0 | 0.00 | 0.00KB | 0.00 | 1964295 | 0 |
| 09 | 0 | 0.00 | 0.00KB | 0.00 | 1933175 | 0 |
| 10 | 0 | 0.00 | 0.00KB | 0.00 | 1932887 | 0 |
| 11 | 0 | 0.00 | 0.00KB | 0.00 | 1975271 | 0 |
| 12 | 0 | 0.00 | 0.00KB | 0.00 | 1735578 | 0 |
| 13 | 0 | 0.00 | 0.00KB | 0.00 | 1955586 | 0 |
| 14 | 0 | 0.00 | 0.00KB | 0.00 | 1898048 | 0 |
| 15 | 0 | 0.00 | 0.00KB | 0.00 | 1942916 | 0 |
| 16 | 0 | 0.00 | 0.00KB | 0.00 | 2019477 | 0 |
| 17 | 0 | 0.00 | 0.00KB | 0.00 | 2010469 | 0 |
| 18 | 0 | 0.00 | 0.00KB | 0.00 | 1934103 | 0 |
| 19 | 0 | 0.00 | 0.00KB | 0.00 | 1910260 | 0 |
| 20 | 0 | 0.00 | 0.00KB | 0.00 | 1887125 | 0 |
| 21 | 0 | 0.00 | 0.00KB | 0.00 | 1889147 | 0 |
| 22 | 0 | 0.00 | 0.00KB | 0.00 | 1822424 | 0 |
| 23 | 0 | 0.00 | 0.00KB | 0.00 | 1762285 | 0 |
| Total | 0 | 0.00 | 0.00KB | 0.00 | 46018975 | 0 |
 |
| >= 20% Full | >= 35% Full | >= 50% Full | >= 65% Full | >= 80% Full | >= 95% Full |
| Outgoing Feed | Batch Seq | Batch Num | Batch Max | %Full | Av. Pending |
|---|---|---|---|---|---|
| nbr.elbracht.net-o | 963872-963953 | 81 | 500 | 16 | 0.0 |
| text-spool-out | 0-0 | 0 | 500 | 0 | 0.0 |
| 1st Time | Last Time | # Msgs | Message |
|---|---|---|---|
| 18:04:32 | 1 | DNS Fwd/Rev mismatch: lookup of scanner-27.ch1.censys-scanner.com failed |