| |
DIABLO statistics for newsfeed.yoursite.com on Tue 25 Jun 2024 |
Generated on 20240625 2358 by feeder-stats v4.006. Copyright © 2002 The Diablo Project.
Diablo running processes:  85    Dnewslink running processes:  0


11:59PM  up 128 days,  7:19, 0 users, load averages: 7.05, 6.79, 7.01

Filesystem     Size    Used   Avail Capacity  Mounted on
/dev/da0s1g     94G    2.1G     84G     2%    /news
/dev/da1       7.3T    6.6T     84G    99%    /news2/spool/news/00
/dev/da2       7.3T    6.6T     86G    99%    /news2/spool/news/01
/dev/da3       3.7T    3.3T     66G    98%    /news2/spool/news/02
/dev/da4       5.5T      5T     58G    99%    /news2/spool/news/03
/dev/da8       7.3T    6.6T     78G    99%    /news2/spool/news/04
/dev/da9       7.3T    6.6T     89G    99%    /news2/spool/news/05
/dev/da10      7.3T    6.6T     85G    99%    /news2/spool/news/06
/dev/da11      5.5T      5T     77G    98%    /news2/spool/news/07
/dev/da12      5.5T      5T     65G    99%    /news2/spool/news/08
/dev/da13      7.3T    6.6T     81G    99%    /news2/spool/news/09
/dev/da14      7.3T    6.6T     90G    99%    /news2/spool/news/10
/dev/da15      7.3T    6.6T     87G    99%    /news2/spool/news/11
/dev/da16      7.3T    6.6T     82G    99%    /news2/spool/news/12
/dev/da17      7.3T    6.6T     85G    99%    /news2/spool/news/13
/dev/da18      7.3T    6.6T     80G    99%    /news2/spool/news/14
/dev/da19      7.3T    6.6T     89G    99%    /news2/spool/news/15
/dev/da20      7.3T    6.6T     87G    99%    /news2/spool/news/16
/dev/da21      7.3T    6.6T     84G    99%    /news2/spool/news/17
/dev/da22      7.3T    6.6T     86G    99%    /news2/spool/news/18
/dev/da23      7.3T    6.6T     82G    99%    /news2/spool/news/19
/dev/da24      7.3T    6.6T     90G    99%    /news2/spool/news/20
/dev/da25      7.3T    6.6T     88G    99%    /news2/spool/news/21
/dev/da26      7.3T    6.6T     85G    99%    /news2/spool/news/22
/dev/da5       221G     36G    167G    18%    /news1
/dev/md0        40G     15G     20G    43%    /news3
| Incoming Feed (+ Top1000 #) | Accepted | %Acc | %Tot | Art/sec | Volume | %Vol | KB/art | Check | Ihave | Spam | TooOld | Rejs | Errs | ||
|---|---|---|---|---|---|---|---|---|---|---|---|---|---|---|---|
| 1 | feeder.ecngs.de | 45020014 | 90.20 | 99.66 | 521.06 | 30.38TB | 100.00 | 724.64 | 47622828 | 0 | 0 | 0 | 2285956 | 0 | |
| 2 | feeder2.ecngs.de | 153541 | 75.25 | 0.34 | 1.78 | 1.50GB | 0.00 | 10.23 | 202767 | 0 | 0 | 0 | 1264 | 0 | |
| Total | 45173555 | 0.00 | 100.00 | 522.84 | 30.38TB | 100.00 | 722.22 | 47825595 | 0 | 0 | 0 | 2287220 | 0 | ||
 |
| Incoming Feed (+ Top1000 #) | Volume | %Vol | Kbps | Accepted | %Acc | %Tot | KB/art | Check | Ihave | Spam | TooOld | Rejs | Errs | ||
|---|---|---|---|---|---|---|---|---|---|---|---|---|---|---|---|
| 1 | feeder.ecngs.de | 30.38TB | 100.00 | 3020694.66 | 45020014 | 90.20 | 99.66 | 724.64 | 47622828 | 0 | 0 | 0 | 2285956 | 0 | |
| 2 | feeder2.ecngs.de | 1.50GB | 0.00 | 145.61 | 153541 | 75.25 | 0.34 | 10.23 | 202767 | 0 | 0 | 0 | 1264 | 0 | |
| Total | 30.38TB | 100.00 | 3020840.27 | 45173555 | 0.00 | 100.00 | 722.22 | 47825595 | 0 | 0 | 0 | 2287220 | 0 | ||
 |
| Incoming Feed (+ Top1000 #) | Rej. Vol. | %Vol | Kbps | Accepted | %Acc | %Tot | KB/art | Check | Ihave | Spam | TooOld | Rejs | Errs | ||
|---|---|---|---|---|---|---|---|---|---|---|---|---|---|---|---|
| 1 | feeder.ecngs.de | 28.59MB | 69.54 | 2.71 | 45020014 | 90.20 | 99.66 | 724.64 | 47622828 | 0 | 0 | 0 | 2285956 | 0 | |
| 2 | feeder2.ecngs.de | 12.52MB | 30.46 | 1.19 | 153541 | 75.25 | 0.34 | 10.23 | 202767 | 0 | 0 | 0 | 1264 | 0 | |
| Total | 41.11MB | 100.00 | 3.90 | 45173555 | 0.00 | 100.00 | 722.22 | 47825595 | 0 | 0 | 0 | 2287220 | 0 | ||
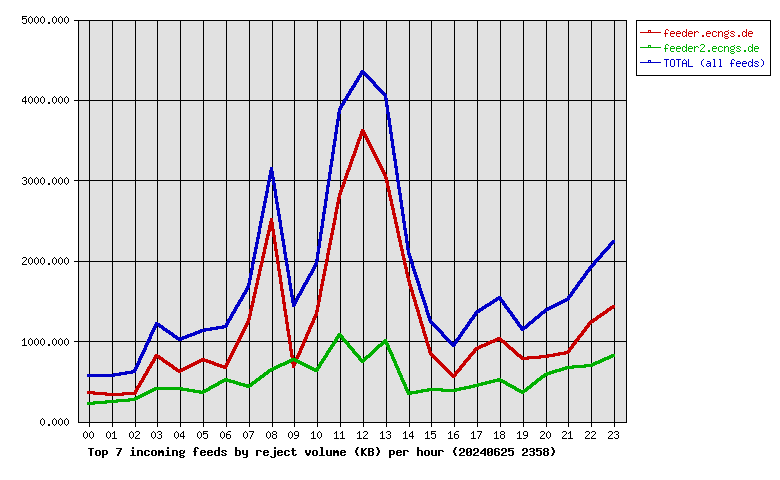 |
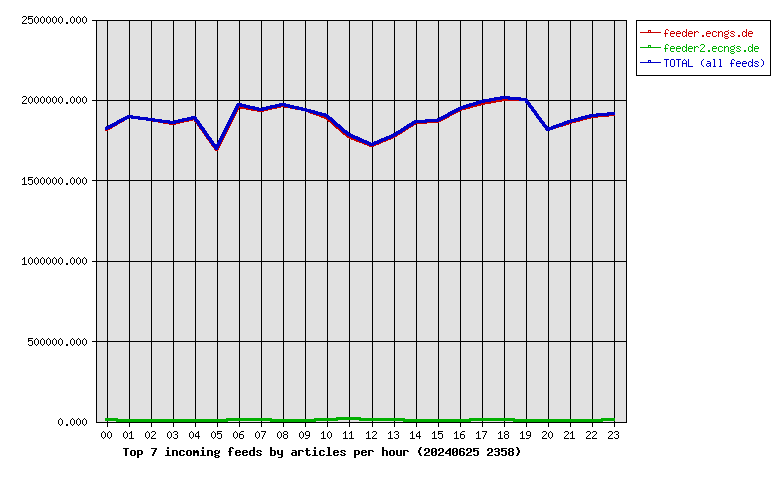
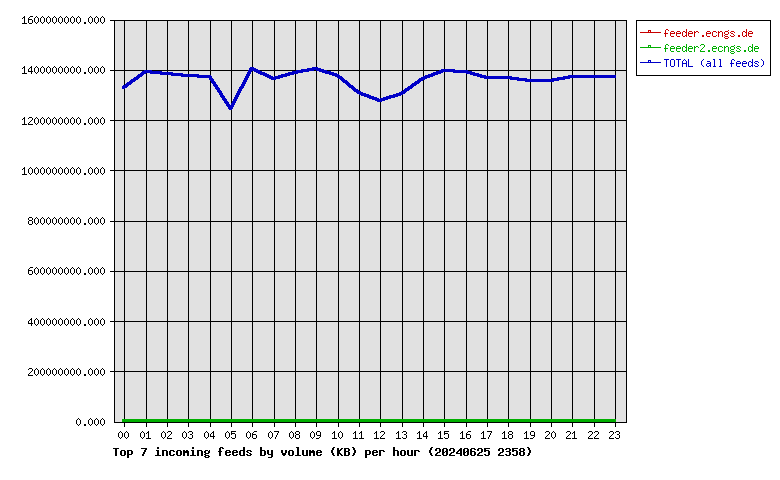
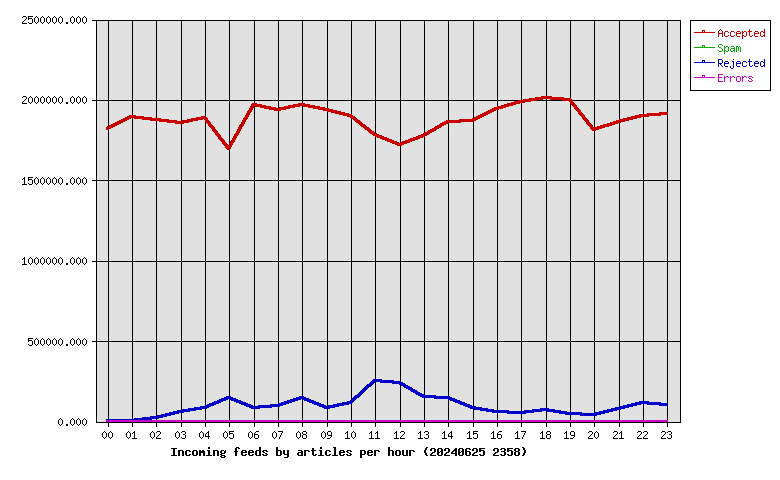
| Hour | Accepted | %Acc | Volume | %Vol | Check | Ihave | Spam | Rejs | Errs |
|---|---|---|---|---|---|---|---|---|---|
| 00 | 1819061 | 4.03 | 1.24TB | 4.07 | 1830392 | 0 | 0 | 166 | 0 |
| 01 | 1896389 | 4.20 | 1.30TB | 4.27 | 1903674 | 0 | 0 | 607 | 0 |
| 02 | 1876177 | 4.15 | 1.29TB | 4.24 | 1902295 | 0 | 0 | 20349 | 0 |
| 03 | 1854738 | 4.11 | 1.28TB | 4.22 | 1922427 | 0 | 0 | 61839 | 0 |
| 04 | 1884826 | 4.17 | 1.28TB | 4.20 | 1977479 | 0 | 0 | 84402 | 0 |
| 05 | 1692205 | 3.75 | 1.16TB | 3.81 | 1961876 | 0 | 0 | 147028 | 0 |
| 06 | 1965991 | 4.35 | 1.31TB | 4.31 | 2065558 | 0 | 0 | 81412 | 0 |
| 07 | 1939363 | 4.29 | 1.27TB | 4.18 | 2045488 | 0 | 0 | 95272 | 0 |
| 08 | 1967472 | 4.36 | 1.29TB | 4.26 | 2122408 | 0 | 0 | 147495 | 0 |
| 09 | 1937942 | 4.29 | 1.31TB | 4.30 | 2027231 | 0 | 0 | 82895 | 0 |
| 10 | 1900029 | 4.21 | 1.28TB | 4.21 | 2037041 | 0 | 0 | 117774 | 0 |
| 11 | 1784261 | 3.95 | 1.22TB | 4.01 | 2058513 | 0 | 0 | 253064 | 0 |
| 12 | 1717908 | 3.80 | 1.19TB | 3.91 | 1968740 | 0 | 0 | 237111 | 0 |
| 13 | 1775812 | 3.93 | 1.21TB | 3.99 | 1946062 | 0 | 0 | 154313 | 0 |
| 14 | 1860063 | 4.12 | 1.27TB | 4.18 | 2015203 | 0 | 0 | 146319 | 0 |
| 15 | 1870551 | 4.14 | 1.30TB | 4.28 | 1960632 | 0 | 0 | 82307 | 0 |
| 16 | 1943987 | 4.30 | 1.30TB | 4.27 | 2010633 | 0 | 0 | 60729 | 0 |
| 17 | 1985282 | 4.39 | 1.27TB | 4.19 | 2050610 | 0 | 0 | 54847 | 0 |
| 18 | 2009762 | 4.45 | 1.27TB | 4.19 | 2097863 | 0 | 0 | 70731 | 0 |
| 19 | 2002205 | 4.43 | 1.26TB | 4.15 | 2056842 | 0 | 0 | 46514 | 0 |
| 20 | 1815401 | 4.02 | 1.26TB | 4.16 | 1866709 | 0 | 0 | 43299 | 0 |
| 21 | 1860569 | 4.12 | 1.28TB | 4.20 | 1947280 | 0 | 0 | 78527 | 0 |
| 22 | 1899211 | 4.20 | 1.28TB | 4.20 | 2021589 | 0 | 0 | 115604 | 0 |
| 23 | 1914350 | 4.24 | 1.28TB | 4.20 | 2029050 | 0 | 0 | 104616 | 0 |
| Total | 45173555 | 100.00 | 30.38TB | 100.00 | 47825595 | 0 | 0 | 2287220 | 0 |
 |
| Outgoing Feed (+ Top1000 #) | Accepted | %Acc | %Tot | Art/sec | Volume | %Vol | KB/art | Dups | Rejs | % Ratio (Out/In) | ||
|---|---|---|---|---|---|---|---|---|---|---|---|---|
| 1 | 217.73.144.40 | 2 | 0.00 | 100.00 | 0.00 | 1.32KB | 100.00 | 0.66 | 44155852 | 0 | … | |
| Total | 2 | 0.00 | 100.00 | 0.00 | 1.32KB | 100.00 | 0.66 | 44155852 | 0 | 0.00 | ||
 |
| Outgoing Feed (+ Top1000 #) | Volume | %Vol | Kbps | Accepted | %Acc | %Tot | KB/art | Dups | Rejs | % Ratio (Out/In) | ||
|---|---|---|---|---|---|---|---|---|---|---|---|---|
| 1 | 217.73.144.40 | 1.32KB | 100.00 | 0.00 | 2 | 0.00 | 100.00 | 0.66 | 44155852 | 0 | … | |
| Total | 1.32KB | 100.00 | 0.00 | 2 | 0.00 | 100.00 | 0.66 | 44155852 | 0 | 0.00 | ||
 |
| Outgoing Feed (+ Top1000 #) | Rej. Vol. | %Vol | Kbps | Accepted | %Acc | %Tot | KB/art | Dups | Rejs | % Ratio (Out/In) | ||
|---|---|---|---|---|---|---|---|---|---|---|---|---|
| 1 | 217.73.144.40 | 0.00KB | 0.00 | 0.00 | 2 | 0.00 | 100.00 | 0.66 | 44155852 | 0 | … | |
| Total | 0.00KB | 0.00 | 0.00 | 2 | 0.00 | 100.00 | 0.66 | 44155852 | 0 | 0.00 | ||
 |
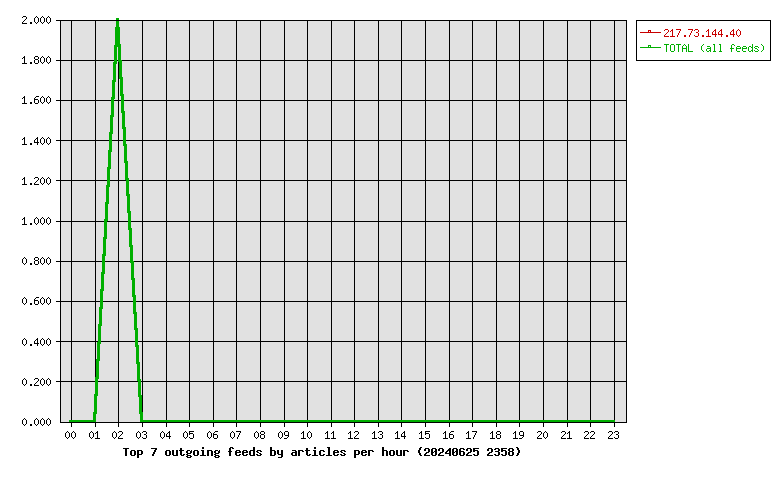
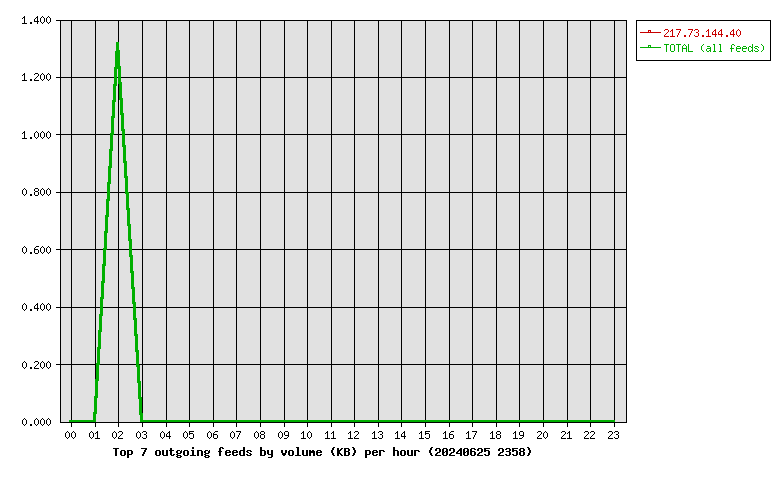
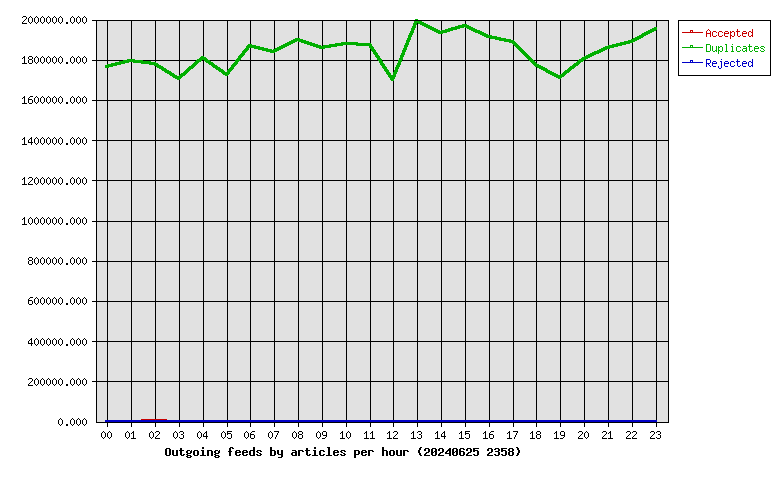
| Hour | Accepted | %Acc | Volume | %Vol | dups | Rejs |
|---|---|---|---|---|---|---|
| 00 | 0 | 0.00 | 0.00KB | 0.00 | 1763036 | 0 |
| 01 | 0 | 0.00 | 0.00KB | 0.00 | 1794066 | 0 |
| 02 | 2 | 100.00 | 1.32KB | 100.00 | 1777384 | 0 |
| 03 | 0 | 0.00 | 0.00KB | 0.00 | 1702961 | 0 |
| 04 | 0 | 0.00 | 0.00KB | 0.00 | 1808185 | 0 |
| 05 | 0 | 0.00 | 0.00KB | 0.00 | 1724158 | 0 |
| 06 | 0 | 0.00 | 0.00KB | 0.00 | 1867785 | 0 |
| 07 | 0 | 0.00 | 0.00KB | 0.00 | 1839177 | 0 |
| 08 | 0 | 0.00 | 0.00KB | 0.00 | 1896997 | 0 |
| 09 | 0 | 0.00 | 0.00KB | 0.00 | 1856649 | 0 |
| 10 | 0 | 0.00 | 0.00KB | 0.00 | 1878655 | 0 |
| 11 | 0 | 0.00 | 0.00KB | 0.00 | 1873805 | 0 |
| 12 | 0 | 0.00 | 0.00KB | 0.00 | 1696851 | 0 |
| 13 | 0 | 0.00 | 0.00KB | 0.00 | 1991392 | 0 |
| 14 | 0 | 0.00 | 0.00KB | 0.00 | 1933304 | 0 |
| 15 | 0 | 0.00 | 0.00KB | 0.00 | 1966000 | 0 |
| 16 | 0 | 0.00 | 0.00KB | 0.00 | 1913212 | 0 |
| 17 | 0 | 0.00 | 0.00KB | 0.00 | 1889827 | 0 |
| 18 | 0 | 0.00 | 0.00KB | 0.00 | 1774509 | 0 |
| 19 | 0 | 0.00 | 0.00KB | 0.00 | 1707022 | 0 |
| 20 | 0 | 0.00 | 0.00KB | 0.00 | 1802303 | 0 |
| 21 | 0 | 0.00 | 0.00KB | 0.00 | 1858707 | 0 |
| 22 | 0 | 0.00 | 0.00KB | 0.00 | 1889552 | 0 |
| 23 | 0 | 0.00 | 0.00KB | 0.00 | 1950315 | 0 |
| Total | 2 | 100.00 | 1.32KB | 100.00 | 44155852 | 0 |
 |
| >= 20% Full | >= 35% Full | >= 50% Full | >= 65% Full | >= 80% Full | >= 95% Full |
| Outgoing Feed | Batch Seq | Batch Num | Batch Max | %Full | Av. Pending |
|---|---|---|---|---|---|
| nbr.elbracht.net-o | 963583-963664 | 81 | 500 | 16 | 0.0 |
| text-spool-out | 0-0 | 0 | 500 | 0 | 0.0 |
| 1st Time | Last Time | # Msgs | Message |
|---|