| |
DIABLO statistics for newsfeed.yoursite.com on Mon 24 Jun 2024 |
Generated on 20240624 2358 by feeder-stats v4.006. Copyright © 2002 The Diablo Project.
Diablo running processes:  83    Dnewslink running processes:  0


11:59PM  up 127 days,  7:19, 0 users, load averages: 6.40, 6.29, 6.16

Filesystem     Size    Used   Avail Capacity  Mounted on
/dev/da0s1g     94G    2.0G     84G     2%    /news
/dev/da1       7.3T    6.6T     71G    99%    /news2/spool/news/00
/dev/da2       7.3T    6.6T     74G    99%    /news2/spool/news/01
/dev/da3       3.7T    3.3T     58G    98%    /news2/spool/news/02
/dev/da4       5.5T      5T     54G    99%    /news2/spool/news/03
/dev/da8       7.3T    6.6T     68G    99%    /news2/spool/news/04
/dev/da9       7.3T    6.6T     73G    99%    /news2/spool/news/05
/dev/da10      7.3T    6.6T     75G    99%    /news2/spool/news/06
/dev/da11      5.5T      5T     48G    99%    /news2/spool/news/07
/dev/da12      5.5T      5T     53G    99%    /news2/spool/news/08
/dev/da13      7.3T    6.6T     70G    99%    /news2/spool/news/09
/dev/da14      7.3T    6.6T     79G    99%    /news2/spool/news/10
/dev/da15      7.3T    6.6T     74G    99%    /news2/spool/news/11
/dev/da16      7.3T    6.6T     70G    99%    /news2/spool/news/12
/dev/da17      7.3T    6.6T     70G    99%    /news2/spool/news/13
/dev/da18      7.3T    6.6T     72G    99%    /news2/spool/news/14
/dev/da19      7.3T    6.6T     75G    99%    /news2/spool/news/15
/dev/da20      7.3T    6.6T     76G    99%    /news2/spool/news/16
/dev/da21      7.3T    6.6T     70G    99%    /news2/spool/news/17
/dev/da22      7.3T    6.6T     74G    99%    /news2/spool/news/18
/dev/da23      7.3T    6.6T     73G    99%    /news2/spool/news/19
/dev/da24      7.3T    6.6T     77G    99%    /news2/spool/news/20
/dev/da25      7.3T    6.6T     76G    99%    /news2/spool/news/21
/dev/da26      7.3T    6.6T     72G    99%    /news2/spool/news/22
/dev/da5       221G     36G    167G    18%    /news1
/dev/md0        40G     15G     20G    43%    /news3
| Incoming Feed (+ Top1000 #) | Accepted | %Acc | %Tot | Art/sec | Volume | %Vol | KB/art | Check | Ihave | Spam | TooOld | Rejs | Errs | ||
|---|---|---|---|---|---|---|---|---|---|---|---|---|---|---|---|
| 1 | feeder.ecngs.de | 44560278 | 83.31 | 99.69 | 515.74 | 29.64TB | 100.00 | 714.16 | 49204015 | 0 | 0 | 0 | 4281762 | 0 | |
| 2 | feeder2.ecngs.de | 137396 | 74.75 | 0.31 | 1.59 | 1.33GB | 0.00 | 10.17 | 182518 | 0 | 0 | 0 | 1296 | 0 | |
| Total | 44697674 | 0.00 | 100.00 | 517.33 | 29.64TB | 100.00 | 711.99 | 49386533 | 0 | 0 | 0 | 4283058 | 0 | ||
 |
| Incoming Feed (+ Top1000 #) | Volume | %Vol | Kbps | Accepted | %Acc | %Tot | KB/art | Check | Ihave | Spam | TooOld | Rejs | Errs | ||
|---|---|---|---|---|---|---|---|---|---|---|---|---|---|---|---|
| 1 | feeder.ecngs.de | 29.64TB | 100.00 | 2946571.41 | 44560278 | 83.31 | 99.69 | 714.16 | 49204015 | 0 | 0 | 0 | 4281762 | 0 | |
| 2 | feeder2.ecngs.de | 1.33GB | 0.00 | 129.39 | 137396 | 74.75 | 0.31 | 10.17 | 182518 | 0 | 0 | 0 | 1296 | 0 | |
| Total | 29.64TB | 100.00 | 2946700.80 | 44697674 | 0.00 | 100.00 | 711.99 | 49386533 | 0 | 0 | 0 | 4283058 | 0 | ||
 |
| Incoming Feed (+ Top1000 #) | Rej. Vol. | %Vol | Kbps | Accepted | %Acc | %Tot | KB/art | Check | Ihave | Spam | TooOld | Rejs | Errs | ||
|---|---|---|---|---|---|---|---|---|---|---|---|---|---|---|---|
| 1 | feeder.ecngs.de | 60.27MB | 83.36 | 5.71 | 44560278 | 83.31 | 99.69 | 714.16 | 49204015 | 0 | 0 | 0 | 4281762 | 0 | |
| 2 | feeder2.ecngs.de | 12.03MB | 16.64 | 1.14 | 137396 | 74.75 | 0.31 | 10.17 | 182518 | 0 | 0 | 0 | 1296 | 0 | |
| Total | 72.30MB | 100.00 | 6.85 | 44697674 | 0.00 | 100.00 | 711.99 | 49386533 | 0 | 0 | 0 | 4283058 | 0 | ||
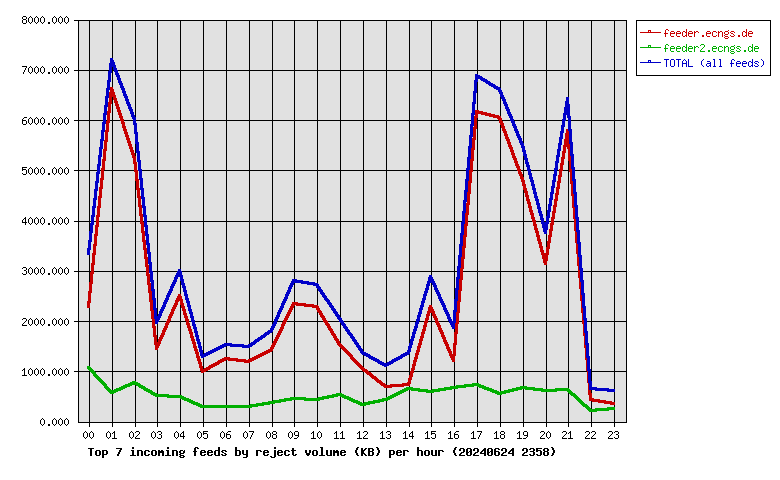 |
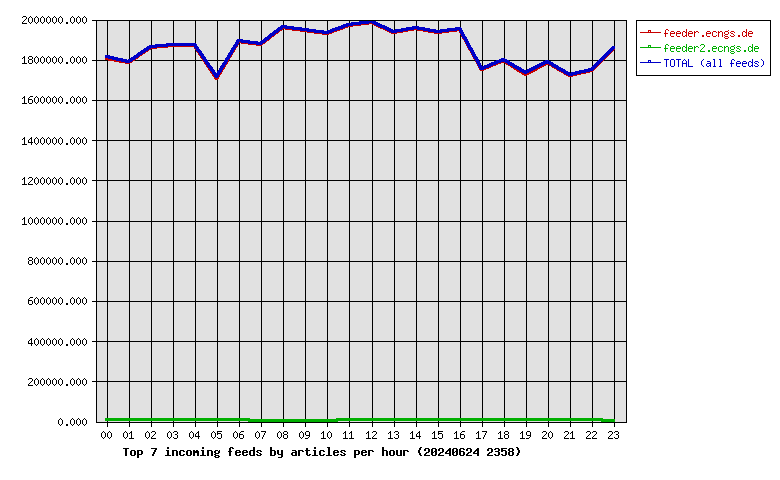
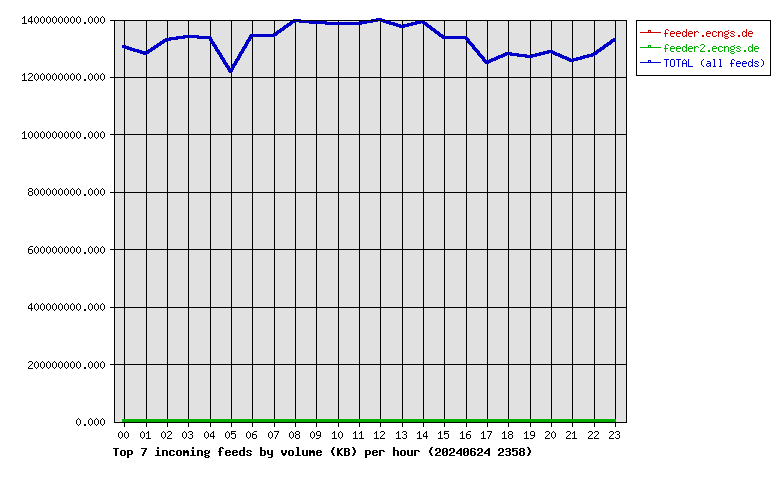
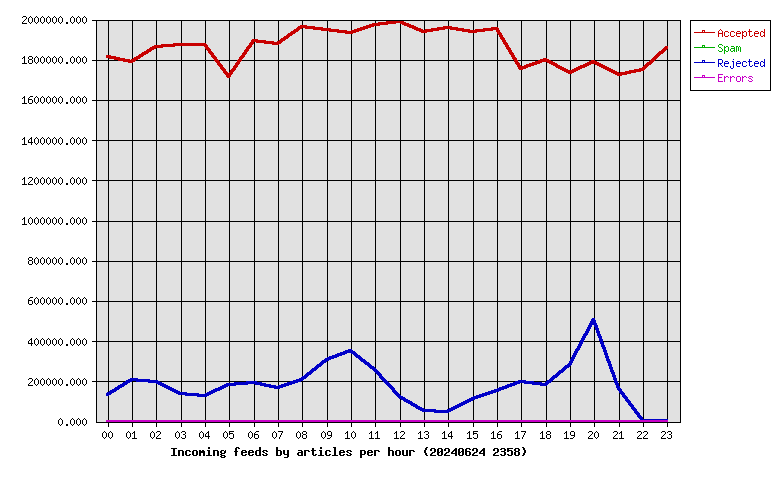
| Hour | Accepted | %Acc | Volume | %Vol | Check | Ihave | Spam | Rejs | Errs |
|---|---|---|---|---|---|---|---|---|---|
| 00 | 1811609 | 4.05 | 1.22TB | 4.10 | 1957557 | 0 | 0 | 132376 | 0 |
| 01 | 1788127 | 4.00 | 1.19TB | 4.02 | 2003004 | 0 | 0 | 204822 | 0 |
| 02 | 1863904 | 4.17 | 1.24TB | 4.18 | 2073685 | 0 | 0 | 198418 | 0 |
| 03 | 1871987 | 4.19 | 1.25TB | 4.21 | 2017958 | 0 | 0 | 136123 | 0 |
| 04 | 1871502 | 4.19 | 1.24TB | 4.20 | 2008794 | 0 | 0 | 127634 | 0 |
| 05 | 1711969 | 3.83 | 1.14TB | 3.83 | 2027610 | 0 | 0 | 182793 | 0 |
| 06 | 1893216 | 4.24 | 1.25TB | 4.22 | 2093027 | 0 | 0 | 191956 | 0 |
| 07 | 1878801 | 4.20 | 1.25TB | 4.21 | 2054104 | 0 | 0 | 168582 | 0 |
| 08 | 1961814 | 4.39 | 1.30TB | 4.38 | 2175333 | 0 | 0 | 206615 | 0 |
| 09 | 1947691 | 4.36 | 1.29TB | 4.36 | 2260307 | 0 | 0 | 306604 | 0 |
| 10 | 1934901 | 4.33 | 1.29TB | 4.35 | 2294200 | 0 | 0 | 351461 | 0 |
| 11 | 1974911 | 4.42 | 1.29TB | 4.35 | 2245679 | 0 | 0 | 258685 | 0 |
| 12 | 1988385 | 4.45 | 1.30TB | 4.39 | 2120547 | 0 | 0 | 120918 | 0 |
| 13 | 1939531 | 4.34 | 1.28TB | 4.32 | 2001955 | 0 | 0 | 52270 | 0 |
| 14 | 1958938 | 4.38 | 1.30TB | 4.37 | 2013966 | 0 | 0 | 46853 | 0 |
| 15 | 1936564 | 4.33 | 1.25TB | 4.20 | 2057193 | 0 | 0 | 111350 | 0 |
| 16 | 1954168 | 4.37 | 1.24TB | 4.20 | 2116409 | 0 | 0 | 152973 | 0 |
| 17 | 1755931 | 3.93 | 1.16TB | 3.92 | 1964785 | 0 | 0 | 198355 | 0 |
| 18 | 1800174 | 4.03 | 1.19TB | 4.02 | 1994907 | 0 | 0 | 183300 | 0 |
| 19 | 1733243 | 3.88 | 1.18TB | 3.99 | 2034021 | 0 | 0 | 282119 | 0 |
| 20 | 1789648 | 4.00 | 1.20TB | 4.04 | 2304531 | 0 | 0 | 503502 | 0 |
| 21 | 1725716 | 3.86 | 1.17TB | 3.94 | 1945852 | 0 | 0 | 164059 | 0 |
| 22 | 1748211 | 3.91 | 1.19TB | 4.01 | 1757596 | 0 | 0 | 1221 | 0 |
| 23 | 1856733 | 4.15 | 1.24TB | 4.17 | 1863513 | 0 | 0 | 69 | 0 |
| Total | 44697674 | 100.00 | 29.64TB | 100.00 | 49386533 | 0 | 0 | 4283058 | 0 |
 |
| Outgoing Feed (+ Top1000 #) | Accepted | %Acc | %Tot | Art/sec | Volume | %Vol | KB/art | Dups | Rejs | % Ratio (Out/In) | ||
|---|---|---|---|---|---|---|---|---|---|---|---|---|
| 1 | 217.73.144.40 | 0 | 0.00 | 0.00 | 0.00 | 0.00KB | 0.00 | 0.00 | 44685589 | 0 | … | |
| Total | 0 | 0.00 | 0.00 | 0.00 | 0.00KB | 0.00 | 0.00 | 44685589 | 0 | |||
 |
| Outgoing Feed (+ Top1000 #) | Volume | %Vol | Kbps | Accepted | %Acc | %Tot | KB/art | Dups | Rejs | % Ratio (Out/In) | ||
|---|---|---|---|---|---|---|---|---|---|---|---|---|
| 1 | 217.73.144.40 | 0.00KB | 0.00 | 0.00 | 0 | 0.00 | 0.00 | 0.00 | 44685589 | 0 | … | |
| Total | 0.00KB | 0.00 | 0.00 | 0 | 0.00 | 0.00 | 0.00 | 44685589 | 0 | |||
 |
| Outgoing Feed (+ Top1000 #) | Rej. Vol. | %Vol | Kbps | Accepted | %Acc | %Tot | KB/art | Dups | Rejs | % Ratio (Out/In) | ||
|---|---|---|---|---|---|---|---|---|---|---|---|---|
| 1 | 217.73.144.40 | 0.00KB | 0.00 | 0.00 | 0 | 0.00 | 0.00 | 0.00 | 44685589 | 0 | … | |
| Total | 0.00KB | 0.00 | 0.00 | 0 | 0.00 | 0.00 | 0.00 | 44685589 | 0 | |||
 |
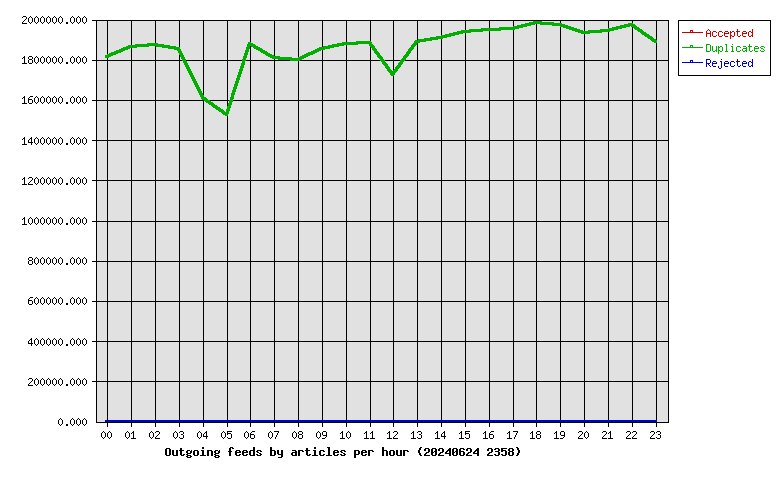
| Hour | Accepted | %Acc | Volume | %Vol | dups | Rejs |
|---|---|---|---|---|---|---|
| 00 | 0 | 0.00 | 0.00KB | 0.00 | 1812719 | 0 |
| 01 | 0 | 0.00 | 0.00KB | 0.00 | 1864456 | 0 |
| 02 | 0 | 0.00 | 0.00KB | 0.00 | 1874113 | 0 |
| 03 | 0 | 0.00 | 0.00KB | 0.00 | 1853198 | 0 |
| 04 | 0 | 0.00 | 0.00KB | 0.00 | 1611776 | 0 |
| 05 | 0 | 0.00 | 0.00KB | 0.00 | 1524728 | 0 |
| 06 | 0 | 0.00 | 0.00KB | 0.00 | 1878919 | 0 |
| 07 | 0 | 0.00 | 0.00KB | 0.00 | 1807960 | 0 |
| 08 | 0 | 0.00 | 0.00KB | 0.00 | 1796976 | 0 |
| 09 | 0 | 0.00 | 0.00KB | 0.00 | 1853071 | 0 |
| 10 | 0 | 0.00 | 0.00KB | 0.00 | 1876192 | 0 |
| 11 | 0 | 0.00 | 0.00KB | 0.00 | 1885444 | 0 |
| 12 | 0 | 0.00 | 0.00KB | 0.00 | 1721411 | 0 |
| 13 | 0 | 0.00 | 0.00KB | 0.00 | 1885761 | 0 |
| 14 | 0 | 0.00 | 0.00KB | 0.00 | 1907117 | 0 |
| 15 | 0 | 0.00 | 0.00KB | 0.00 | 1937131 | 0 |
| 16 | 0 | 0.00 | 0.00KB | 0.00 | 1948520 | 0 |
| 17 | 0 | 0.00 | 0.00KB | 0.00 | 1952027 | 0 |
| 18 | 0 | 0.00 | 0.00KB | 0.00 | 1983596 | 0 |
| 19 | 0 | 0.00 | 0.00KB | 0.00 | 1970705 | 0 |
| 20 | 0 | 0.00 | 0.00KB | 0.00 | 1933580 | 0 |
| 21 | 0 | 0.00 | 0.00KB | 0.00 | 1942512 | 0 |
| 22 | 0 | 0.00 | 0.00KB | 0.00 | 1974597 | 0 |
| 23 | 0 | 0.00 | 0.00KB | 0.00 | 1889080 | 0 |
| Total | 0 | 0.00 | 0.00KB | 0.00 | 44685589 | 0 |
 |
| >= 20% Full | >= 35% Full | >= 50% Full | >= 65% Full | >= 80% Full | >= 95% Full |
| Outgoing Feed | Batch Seq | Batch Num | Batch Max | %Full | Av. Pending |
|---|---|---|---|---|---|
| nbr.elbracht.net-o | 963295-963376 | 81 | 500 | 16 | 0.0 |
| text-spool-out | 0-0 | 0 | 500 | 0 | 0.0 |
| 1st Time | Last Time | # Msgs | Message |
|---|---|---|---|
| 04:41:57 | 04:42:34 | 24 | DNS Fwd/Rev mismatch: academyforinternetresearch.org/109.74.204.123 |
| 20:30:31 | 1 | DNS Fwd/Rev mismatch: visit.keznews.com/194.165.16.72 |